
PRISMA Flow Diagram: How to Create One

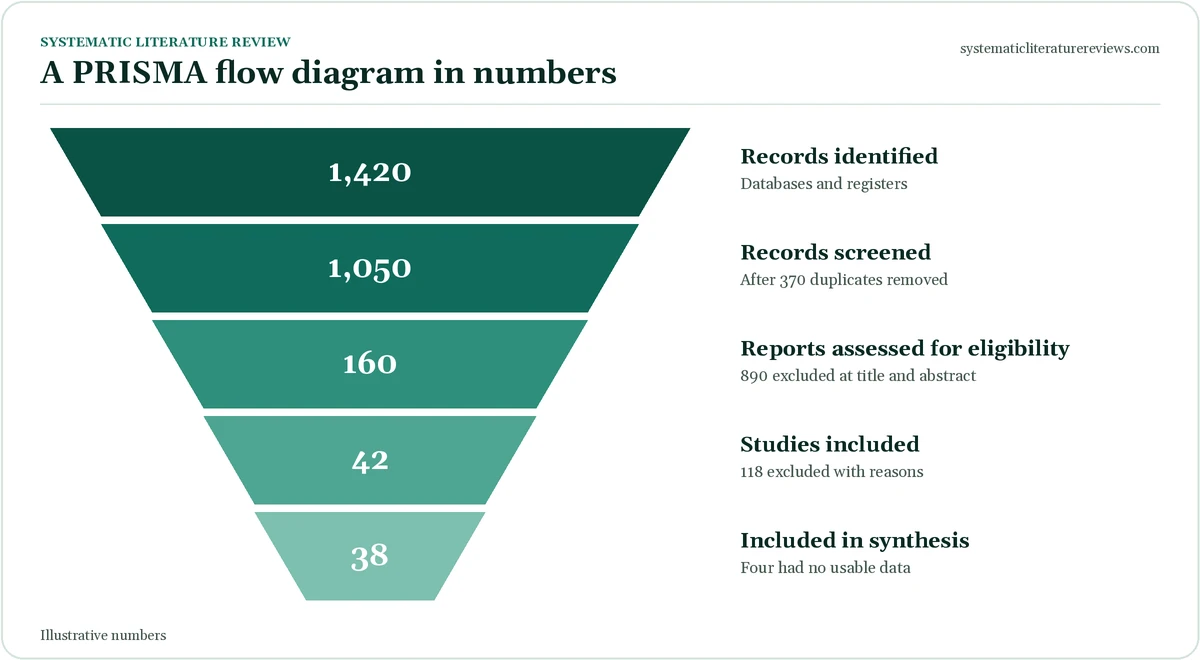
A PRISMA flow diagram is a chart that shows how many records you found, how many you screened and excluded, and how many studies you included in your review. It lets readers follow the selection process from search to final sample.
This guide explains the PRISMA 2020 version of the diagram, gives seven steps with an example at every step, shows the arithmetic with a worked example and lists common mistakes and tools.
- The idea: what the diagram shows and why journals ask for it.
- The method: seven steps and the boxes in the 2020 version.
- The checks: arithmetic, tools and common mistakes.
On this page
- What is a PRISMA flow diagram?
- The stages of the PRISMA 2020 flow diagram
- Step-by-step guide to creating a PRISMA flow diagram
- The arithmetic behind a PRISMA flow diagram
- Tools for creating a PRISMA flow diagram
- Example text to accompany the diagram
- Frequently asked questions about prisma flow diagram
Key takeaways
- A PRISMA flow diagram reports the numbers at each stage of study selection.
- PRISMA 2020 has identification, screening and included stages, with separate paths for databases and other methods.
- Every number must add up, and every exclusion at full text needs a reason.
- Use the free generator or a template and update the numbers if you rerun the search.
What is a PRISMA flow diagram?
It is the standard figure that reports study selection in a systematic review.
- Purpose: to make the selection process transparent and repeatable.
- Source: the PRISMA 2020 statement (Page et al., BMJ 2021), which has a 27-item checklist.
- Where it goes: in the results section, as Figure 1.
- Who needs it: authors of systematic reviews, and many scoping reviews.
- Website: templates are available at the PRISMA statement site.
The stages of the PRISMA 2020 flow diagram
The 2020 diagram has three main stages and two paths: one for databases and registers, and one for other methods.
| Stage | What to report | Example |
|---|---|---|
| Identification | Records found in each database and register; duplicates removed | 2,640 records; 610 duplicates removed |
| Screening | Records screened by title and abstract; records excluded | 2,030 screened; 1,870 excluded |
| Eligibility | Reports sought and assessed in full; excluded with reasons | 160 assessed; 112 excluded |
| Included | Studies and reports included in the review | 48 studies in 50 reports |
- Other methods: citation searching, websites and organisations form a second path.
- Previous version: the 2009 diagram used the same ideas with fewer details.
Step-by-step guide to creating a PRISMA flow diagram
Follow these seven steps. Each has an explanation and an example.
- Record every search. Write down each database, register and website you searched, with the date and the number of records retrieved. Example: PubMed 1,200; Embase 950; CINAHL 490.
- Remove duplicates. Use your reference manager or screening tool, then record how many duplicates you removed and how you found them. Example: 610 removed using EndNote and manual checking.
- Screen titles and abstracts. Count the records screened and the number excluded, using your inclusion and exclusion criteria. Example: 2,030 screened; 1,870 excluded.
- Retrieve full texts. Count the reports you tried to get and the number you could not retrieve. Example: 160 sought; 4 not retrieved.
- Assess full texts and give reasons. Record the number assessed and the exact reasons for each exclusion. Example: 156 assessed; 108 excluded: wrong population 40, wrong outcome 35, wrong design 33.
- Add other methods. Record studies found through citation searching or other sources, and repeat the screening counts. Example: 12 found; 8 assessed; 4 included.
- Draw and check the diagram. Enter the numbers in a template, check that the arithmetic balances and place the figure in your results. Example: 48 + 4 = 52 studies.
The arithmetic behind a PRISMA flow diagram
Every box must follow from the one before. Use these relationships to check your numbers.
- Reasons sum: 40 + 35 + 33 = 108, matching the number excluded.
- Percentage excluded: 108/156 = 69.2% of full texts.
- Total included: 48 from databases plus 4 from other methods gives 52 studies.
Tools for creating a PRISMA flow diagram
You do not need design skills.
- PRISMA2020 Shiny app: a free web tool that produces the diagram from your numbers (PRISMA2020 flow diagram generator).
- Word or PowerPoint: official templates can be edited directly.
- Screening software: Covidence and Rayyan can export counts.
- R package: PRISMA2020 creates diagrams in R.
- Check the style: your journal may require a specific file type or resolution.
Example text to accompany the diagram
The text in your results should summarise the diagram, not repeat it.
Template
The searches identified [N] records. After removing [N] duplicates, [N] records were screened by title and abstract, and [N] reports were assessed in full. [N] studies met the inclusion criteria. The most common reasons for exclusion at full text were [reason] ([N]) and [reason] ([N]). The selection process is shown in Figure 1.
Read more about writing the criteria in inclusion and exclusion criteria.
PRISMA 2020 flow diagram vs the 2009 version
The 2020 update changed the layout.
| Feature | PRISMA 2009 | PRISMA 2020 |
|---|---|---|
| Paths | One path | Databases and registers plus other methods |
| Unit | Records | Records, reports and studies |
| Automation | Not mentioned | Records removed by automation tools reported |
| Previous reviews | Not reported | Studies from earlier versions of living reviews can be shown |
| Reasons for exclusion | Stated at full text | Stated at full text, with numbers |
Practical tips for a clean diagram
Small habits prevent big mistakes.
- Count as you go: update numbers after each stage instead of reconstructing them at the end.
- Use a spreadsheet: keep a table of stages and counts, with the date.
- Use a second reviewer: check the counts with another person.
- Describe what you did: name the tools used for deduplication and screening.
- Update on rerun: if you repeat the search, produce a new diagram or show both.
Common mistakes with the PRISMA flow diagram
Check your diagram against this list.
- Numbers do not add up: the totals differ between boxes. Example: recalculate each step.
- Reasons missing: full-text exclusions have no stated reason. Example: record the reasons as you screen.
- Mixing records and studies: one study can have several reports. Example: report both counts.
- Not reporting duplicates: readers cannot check the starting number. Example: state the number removed.
- Forgetting other methods: citation searching is not shown. Example: add the second path.
Plan your searches first with our literature search strategy guide.
A full walk-through: building the diagram box by box
The walk-through uses the numbers from the arithmetic section and follows the order of the boxes in the diagram.
- Box 1: records identified: list each database with its count, then the registers and other sources. Example: PubMed 1,200; Embase 950; CINAHL 490; total 2,640.
- Box 2: records removed before screening: duplicates, records marked ineligible by automation tools and records removed for other reasons. Example: 610 duplicates removed; 0 by automation.
- Box 3: records screened: the number that remains, which is the identified total minus the removed records. Example: 2,030 records.
- Box 4: records excluded: the number rejected on title and abstract, without detailed reasons. Example: 1,870 records.
- Box 5: reports sought for retrieval: the number sent for full-text retrieval, followed by the number not retrieved. Example: 160 sought; 4 not retrieved.
- Box 6: reports assessed for eligibility: the number read in full, then the excluded reports with the reason for each. Example: 156 assessed; 108 excluded.
- Box 7: studies included: studies and reports that meet the criteria, noting how many reports belong to each study. Example: 48 studies reported in 50 reports.
Living and updated reviews
Some reviews are updated as new evidence appears. The PRISMA 2020 diagram has a version for these cases.
- Previous version: studies included in an earlier version of the review appear in a separate box.
- New searches: report the dates of each new search and the number of new records.
- Cumulative totals: state the total number of studies in the current version.
- Why it matters: readers can see what changed between versions.
- Protocol: state in the protocol how often you will search again and when you will stop.
Adapting the diagram for scoping reviews and rapid reviews
The same logic applies to other review types, with small changes.
| Review type | Reporting guideline | Change to the diagram |
|---|---|---|
| Scoping review | PRISMA-ScR | Report sources of evidence; no risk of bias stage |
| Rapid review | PRISMA 2020 with notes | State shortcuts such as single-reviewer screening |
| Umbrella review | PRISMA 2020 | Records are reviews, not primary studies |
| Qualitative synthesis | PRISMA 2020 or ENTREQ | Report the number of studies by method |
| Living review | PRISMA 2020 living version | Show studies from previous versions |
See the PCC approach in PCC framework.
A counting log you can copy
Keep this table up to date throughout the review. It gives every number in the diagram.
| Date | Stage | Records in | Records out | Note |
|---|---|---|---|---|
| 3 March | Database searches | 0 | 2,640 | Three databases |
| 4 March | Deduplication | 2,640 | 2,030 | 610 removed |
| 10 March | Title and abstract screening | 2,030 | 160 | 1,870 excluded |
| 24 March | Full-text retrieval | 160 | 156 | 4 not retrieved |
| 10 April | Full-text assessment | 156 | 48 | 108 excluded with reasons |
- Add a column: for the name of the person who did the work.
- Freeze the log: before you draw the diagram, and keep a dated copy.
- Use it in your methods: the log supports the sentences in your results section.
Using two reviewers and reporting agreement
Screening is more reliable when two people work independently.
- Independent screening: each reviewer decides without seeing the other’s choice.
- Resolve conflicts: discuss disagreements, or ask a third reviewer.
- Measure agreement: Cohen’s kappa shows agreement beyond chance; values above 0.6 are usually seen as substantial.
- Pilot first: screen the first 50 records together to align interpretation.
- Report it: state how many reviewers screened and how conflicts were resolved.
What journals look for in a PRISMA flow diagram
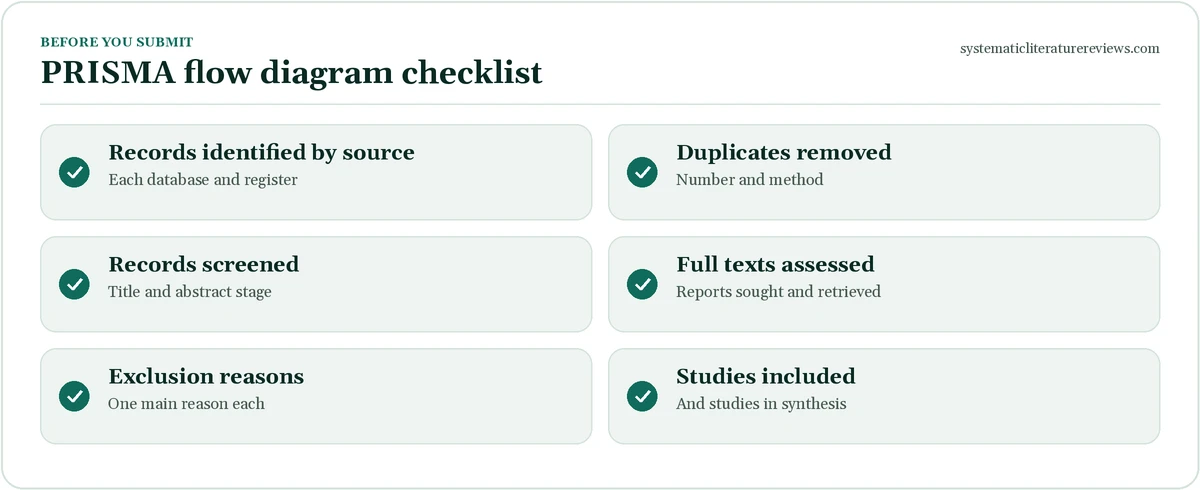
Editors and reviewers check the figure against the text.
- Consistency: numbers in the abstract, text and figure match.
- Completeness: all boxes in the 2020 template are filled or marked not applicable.
- Reasons: exclusion reasons are specific and sum to the total.
- Format: the figure is readable at column width and supplied in the required file type.
- Checklist: the PRISMA checklist is submitted with the manuscript.
Dissertation markers use the same checks, so a clean diagram earns credit.
Reporting the search in the methods
The diagram is only part of the story.
- Methods: describe databases, dates and strategies, and refer to the supplementary file.
- Results: summarise the flow in a short paragraph.
- Appendix: include a list of excluded studies with reasons.
Frequently asked questions about prisma flow diagram
What is a PRISMA flow diagram?
A PRISMA flow diagram is a figure that shows how many records you identified in your searches, how many you screened, how many you excluded at each stage and how many studies you included in your systematic review. It follows the PRISMA 2020 reporting guideline and makes the selection process transparent. Readers can check that the numbers add up, see the reasons for exclusion at full text and judge whether the search was thorough. Most journals expect the diagram in the results section of a systematic review.
Do I need a PRISMA flow diagram for a scoping review?
Yes, in most cases. Scoping reviews follow the PRISMA extension for scoping reviews, called PRISMA-ScR, which also asks for a flow diagram showing the selection of sources of evidence. The diagram is similar to the one for systematic reviews, but it usually reports sources of evidence rather than only studies, and it does not require a risk of bias stage. If your supervisor or journal gives a template, use it; otherwise adapt the PRISMA 2020 diagram and explain any changes.
How do I report reasons for exclusion at full text?
List each reason with the number of reports excluded, in a box beside the full-text stage. Use short, clear categories such as wrong population, wrong intervention, wrong outcome, wrong study design or not available in English. Each report should be assigned to one main reason, using a fixed order of criteria, so that the numbers add up to the total excluded. Keep a table of excluded studies with their reasons as supplementary material so that readers can check your decisions.
What tool should I use to make a PRISMA flow diagram?
The simplest option is the free PRISMA2020 web app, which creates the diagram from the numbers you enter and lets you download it in several formats. You can also use the official Word or PowerPoint templates, an R package or any drawing tool. Screening software such as Covidence and Rayyan can export the counts. Whichever tool you use, check that the arithmetic balances, the text is readable at journal size and the figure is saved at the resolution your journal requires.
Need expert help? Our experienced writers can handle the search, screening and write-up for you. Place your order in two minutes, or read how a systematic literature review works first.
Systematic Literature Reviews
Need a systematic literature review?
PRISMA-aligned searching, screening, appraisal and synthesis, written for your protocol.