
Blog
Types of Quantitative Research Designs With Example
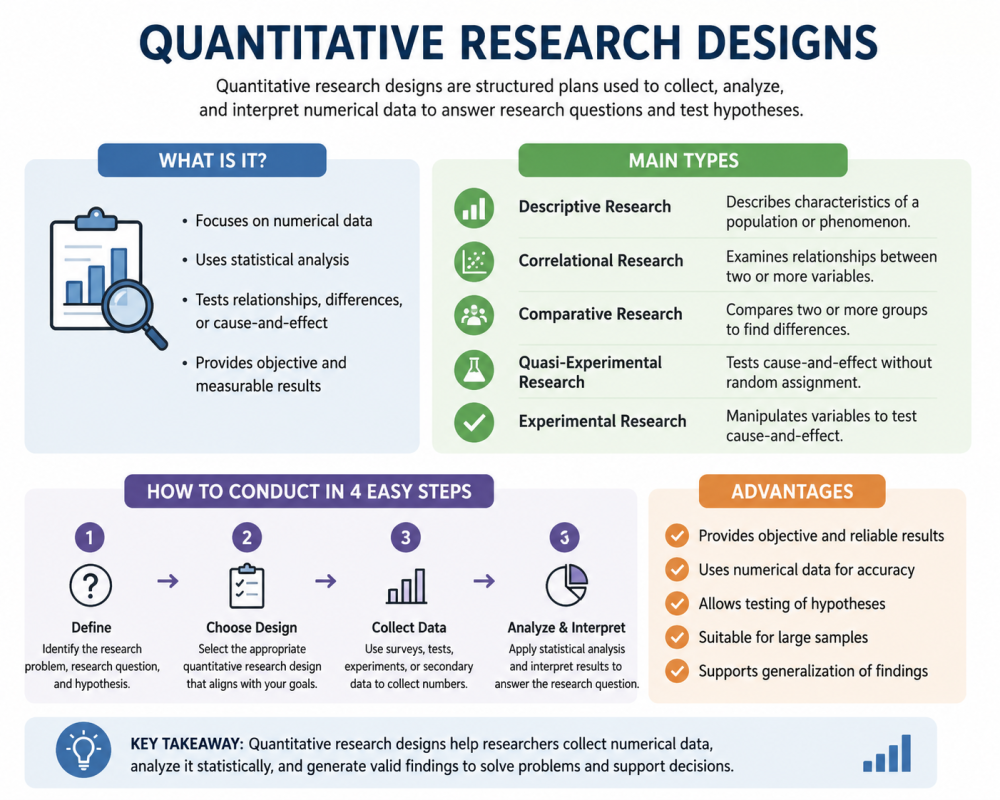
What is Quantitative Research Designs?
- Quantitative Research Designs are structured plans that guide how a researcher collects, measures, compares, and analyses numerical data in a research study. In simple terms, a quantitative research design explains how the study will use numbers to answer the research question, test hypotheses, and produce statistical research findings.
- Quantitative research focuses on measurable facts rather than personal opinions or experiences. For example, instead of asking participants to describe how they feel about online learning, a researcher may collect test score results, questionnaire ratings, attendance records, or satisfaction scores. This makes quantitative data useful for measuring patterns, trends, differences, and relationships between variables.
- A quantitative research design is important because it connects the research problem, research question, hypothesis, data collection methods, and data analysis into one clear methodology. Without a strong research design, the researcher may collect data that does not answer the research questions properly.
- Quantitative research collects numerical data that can be counted, ranked, measured, or compared. This may include percentages, averages, scores, frequencies, income levels, age groups, customer ratings, test results, or market research statistics.
- Quantitative Research Designs are often used when the researcher wants to measure a variable, compare two or more groups, study the correlation between two or more variables, or examine a possible cause-and-effect relationship.
- A strong quantitative research design helps improve reliability and validity. Reliability means the results can be repeated under similar conditions. Validity means the study measures what it claims to measure.
- Quantitative research uses structured tools such as surveys, questionnaires, experiments, observation checklists, secondary data, and statistical tests. These tools help the researcher collect quantitative data in a consistent way.
- Quantitative vs qualitative research is an important distinction. Quantitative research collects numerical data, while qualitative research collects non-numerical data such as interviews, opinions, stories, and personal experiences. However, some research design methods may combine quantitative and qualitative approaches through mixed methods.
- Overall, Quantitative Research Designs help researchers answer research questions using measurable evidence, appropriate descriptive and inferential statistics, and clear data collection and analysis procedures.
Types of Quantitative Research Designs
- There are several types of quantitative research design, and each one is used for a different purpose. The main types include descriptive research, correlational research, comparative research, quasi-experimental research, and experimental research design.
- Descriptive research is a type of quantitative research that describes a population, situation, behaviour, or trend as it exists at a specific point in time. It does not try to change or manipulate variables. For example, a researcher may study how many students use online learning platforms, how often customers buy a product, or what percentage of employees are satisfied with workplace training.
- Descriptive research is useful when the research question focuses on “what,” “how many,” “how often,” or “to what extent.” It is common in education, healthcare, business, market research, and social science. A questionnaire, survey research, test score record, or secondary data source may be used to collect descriptive quantitative data.
- Correlational research examines relationships between variables. This design is used when the researcher wants to know whether two or more variables are connected. For example, a study may examine the correlation between study time and exam performance, social media use and sleep quality, or customer satisfaction and repeat purchases.
- A correlational design can show whether variables move together in a positive, negative, or weak relationship. However, correlational research cannot prove that one variable causes another. For example, if students who study longer get higher scores, this does not automatically prove that study time alone caused the higher test score. Other factors may also influence the result.
- Comparative research compares two or more groups to find differences in outcomes. This comparative design may be used when the researcher cannot control or manipulate the independent variable. For example, a researcher may compare test scores between students in public and private schools, customer satisfaction between two service branches, or productivity between remote and office-based employees.
- Comparative studies are useful when the research problem involves differences between groups. The researcher identifies the groups, collects quantitative data, and uses statistical data analysis to determine whether the differences are meaningful.
- Experimental research is one of the strongest quantitative research methods because it tests a cause-and-effect relationship. In an experimental research design, the researcher usually manipulates one or more independent variables and measures the effect on the dependent variable.
- For example, a researcher may test whether a new teaching method improves student test score performance. The teaching method is the independent variable, while the test score is the dependent variable. Participants may be assigned to groups, such as an experimental group and a control group.
- Experimental design is useful when the researcher wants to test hypotheses and determine whether a change in one variable leads to a measurable change in another variable. It is commonly used in psychology, education, healthcare, product testing, and scientific research.
- Quasi-experimental research is similar to experimental research, but participants are not randomly assigned to groups. This type of research is useful in real-world settings where random assignment is not possible. For example, a school may test a new learning program in one class and compare the results with another class.
- Cross-sectional research collects data from participants at one point in time. For example, a researcher may survey 500 customers in June to measure satisfaction with a service. This study design is faster and often more affordable, but it cannot show long-term changes.
- Longitudinal research collects data from the same participants over time. This design type is useful when the researcher wants to study growth, change, or development. For example, a research study may track students’ reading scores over three years.
- Survey research is one of the most common quantitative research design methods. It uses structured questions to collect numerical responses from a sample. A questionnaire may include rating scales, multiple-choice questions, yes/no questions, or frequency-based questions.
- Secondary data research uses existing research data rather than collecting new data. For example, a researcher may use hospital records, government statistics, school performance data, or company sales reports. This method can save time, but the researcher must check the quality, accuracy, and relevance of the data.
- Although case studies are often linked with qualitative methods, some case studies may include quantitative data collection and analysis. For example, a business case study may include sales numbers, website traffic, conversion rates, and customer survey results.
- These quantitative research design types help the researcher choose the most suitable methodology. The design must align with your research design, research question, data collection methods, and planned quantitative data analysis.
Philosophical Assumptions of The Quantitative Research Designs
- Quantitative Research Designs are often based on the belief that reality can be measured objectively. This means the researcher assumes that social, educational, business, or scientific problems can be studied using numbers, measurements, and statistical evidence.
- One major assumption is objectivity. In quantitative studies, the researcher tries to remain neutral and avoid influencing the results. The goal is to collect quantitative data in a structured way so the findings are based on evidence rather than personal opinion.
- Another assumption is that variables can be identified and measured. A variable is something that can change or vary, such as age, income, test score, satisfaction level, study time, or sales performance. Quantitative research often studies relationships between variables or differences between groups.
- Quantitative research also assumes that a hypothesis can be tested. A hypothesis is a clear prediction about what the researcher expects to find. For example, a researcher may hypothesise that students who receive tutoring will score higher than students who do not.
- Another assumption is that data analysis can reveal patterns. Quantitative methods use statistical tools to identify trends, averages, relationships, differences, and possible cause-and-effect relationships.
- Quantitative Research Designs also value generalisation. This means the researcher may study a sample and use the results to make conclusions about a larger population, as long as the sample is suitable and the study design is strong.
- The methodology is usually deductive. This means the researcher begins with a theory, research question, or hypothesis, then collects numerical data to test it. This differs from exploratory qualitative research, where the researcher may begin with broad questions and develop themes from non-numerical data.
- These philosophical assumptions help explain why quantitative research uses structured instruments, careful measurement, statistical testing, and clear procedures for data collection and analysis.
How To Conduct an Quantitative Research Designs In 4 Easy Steps?
- First, define the research problem and research question clearly. A strong quantitative research study begins with a specific issue that can be measured. The research question should be focused, direct, and suitable for numerical data. For example, instead of asking, “How do students feel about online learning?” a quantitative research question may ask, “What is the relationship between online study time and final test score?”
- In this first step, the researcher should also decide whether a hypothesis is needed. A hypothesis is useful when the study aims to test a predicted relationship or difference. For example, “Students who study for more hours per week will have higher test scores than students who study fewer hours.”
- Second, choose the correct quantitative research design. The design should match the purpose of the study. If the goal is to describe a population, descriptive research may be suitable. If the goal is to examine correlation, a correlational design may be best. If the goal is to compare groups, comparative research may fit. If the goal is to test cause and effect, experimental research design may be the strongest option.
- This step is important because different design types answer different questions. The researcher should not choose a design only because it is popular. The research design and data plan must fit the research problem, research question, variables, and available resources.
- Third, collect quantitative data using suitable data collection methods. Common methods include a questionnaire, structured survey research, tests, observation checklists, experiments, and secondary data. The researcher must make sure the tool measures the correct independent and dependent variables.
- The researcher should also decide who will participate in the study, how many people are needed, and how participants will be selected. In experimental research, the researcher may assign participants to groups. In cross-sectional survey research, data may be collected from many participants at one point in time.
- Fourth, analyse and interpret the data. Quantitative data analysis may include descriptive statistics such as percentages, averages, and frequencies. It may also include inferential statistics to test hypotheses, examine correlation, compare groups, or determine whether findings are statistically significant.
- After data analysis, the researcher explains what the results mean in relation to the research question. The findings should be presented clearly, using tables, charts, or written explanations. A strong conclusion should connect the results back to the hypothesis, study design, and research problem.
What are the Advantages and Disadvantages of Quantitative Research Designs?
- One advantage of Quantitative Research Designs is that they produce clear numerical data. This makes it easier to compare results, identify trends, and present findings in a simple way. For example, a business can use customer ratings to measure service quality across different branches.
- Another advantage is objectivity. Since quantitative research uses structured tools and statistical analysis, the researcher can reduce personal bias. This makes the research findings more consistent and easier to verify.
- Quantitative Research Designs are also useful for testing hypotheses. When a researcher wants to know whether there is a relationship, difference, or possible cause-and-effect relationship, quantitative methods provide a strong structure for testing ideas.
- Another benefit is that quantitative studies can include large samples. A large sample can make the findings more reliable and may allow the researcher to generalise results to a wider population.
- Quantitative research design methods are also efficient for surveys, market research, educational testing, healthcare measurement, and business performance analysis. They allow researchers to collect data from many people and analyse it using statistical tools.
- Another advantage is that quantitative research can support decision-making. For example, managers can use sales data, customer satisfaction scores, or employee survey results to make informed decisions.
- However, there are also cons of quantitative research. One disadvantage is that numbers may not explain the full human experience. Quantitative data can show what is happening, but it may not fully explain why people think, feel, or behave in certain ways.
- Another disadvantage is limited flexibility. Because quantitative data collection is usually structured, participants may only choose from fixed answers. This can prevent them from giving deeper explanations.
- Quantitative Research Designs may also require strong statistical knowledge. If the researcher uses the wrong test or misinterprets the results, the findings may be inaccurate.
- Another limitation is that some variables are difficult to measure with numbers. Feelings, beliefs, culture, motivation, and personal experiences may need qualitative research or mixed methods to understand them more deeply.
- In experimental research, manipulation of variables can sometimes be difficult or unethical. For example, a researcher cannot always assign people to harmful conditions just to test an outcome.
- Another limitation is that correlational research cannot prove causation. Even when two variables are related, the researcher must be careful not to claim that one variable directly caused the other.
- The pros and cons of quantitative research show that this approach is powerful, but it must be used carefully. The best results come when the research method, study design, data collection methods, and data analysis all match the purpose of the research.
Examples of Quantitative Research Designs
- A descriptive research example could examine how many university students use digital libraries each week. The researcher may use a questionnaire to collect numerical data on frequency of use, hours spent, preferred resources, and satisfaction ratings. This type of quantitative research is useful because it describes behaviour without changing any variables.
- A correlational research example could study the relationship between study time and exam test score. The researcher collects data on how many hours students study each week and compares this with their final scores. The data analysis may show a positive correlation, but the researcher should remember that correlation does not prove causation.
- A comparative research example could compare the performance of students who attend online classes with students who attend face-to-face classes. The dependent variable may be the final test score, while the group type may act as the independent variable. This comparative design helps identify whether there is a statistical difference between the two groups.
- An experimental research design example could test whether a new reading programme improves literacy scores. The researcher may assign participants to groups, give one group the new programme, and keep another group under the normal teaching method. The independent variable is the reading programme, while the dependent variable is the literacy test score.
- A cross-sectional survey research example could measure customer satisfaction with a mobile banking app at one point in time. The researcher may collect quantitative data through a structured questionnaire using rating scales. This can help answer research questions about usability, trust, speed, and customer loyalty.
- A secondary data example could examine hospital records to study whether patient waiting time is related to satisfaction scores. The researcher does not collect new data but analyses existing research data. This method is useful when the available data is accurate, complete, and aligned with the research question.
- A market research example could measure how price changes affect customer buying behaviour. The researcher may collect sales numbers, customer ratings, and purchase frequency data. This type of research can help businesses make decisions based on quantitative data analysis.
- These examples show how Quantitative Research Designs can be used in education, healthcare, business, psychology, and social science. Whether the study is descriptive, correlational, comparative, cross-sectional, or experimental, the goal is to collect quantitative data, analyse it statistically, and answer research questions using measurable evidence.
- In conclusion, Quantitative Research Designs are valuable because they give researchers a clear way to measure variables, test hypotheses, compare groups, and study relationships between variables. When the researcher chooses the right quantitative research design, uses reliable data collection methods, and applies appropriate descriptive and inferential statistics, the study becomes stronger, clearer, and more useful.