
Systematic Review Example

This systematic review example walks through a complete, small review from the question to the results text. The data are invented for teaching, so do not cite them, but the steps, numbers and wording show how a real review fits together.
You will see the question and PICOS, the protocol, the search, the flow numbers, a risk of bias summary, the extraction table, a pooled estimate with equations and a short results and discussion text.
- The plan: question, protocol and search.
- The selection: flow numbers, appraisal and extraction.
- The results: pooled estimate, text and discussion.
Key takeaways
- The example asks whether bedside handover reduces medication errors on adult wards.
- The search found 2,640 records; 12 studies were included and 3 are pooled in the worked calculation.
- The pooled risk ratio is 0.73 (95% CI 0.59 to 0.90) in the illustration.
- All numbers are illustrative and should not be cited as real evidence.
The example at a glance
The table summarises the review before the detail. Everything here is illustrative.
| Item | Entry |
|---|---|
| Title | Bedside handover and medication errors on adult wards: a systematic review (illustrative) |
| Question | Does bedside nursing handover reduce medication errors compared with desk handover? |
| Databases | MEDLINE, CINAHL and Embase, searched on 3 March 2026 |
| Records identified | 2,640 |
| Studies included | 12 (3 used in the worked pooled calculation) |
| Main result | Pooled risk ratio 0.73, 95% CI 0.59 to 0.90 |
For the method behind it, see the systematic literature review guide.
Step 1: the question and PICOS
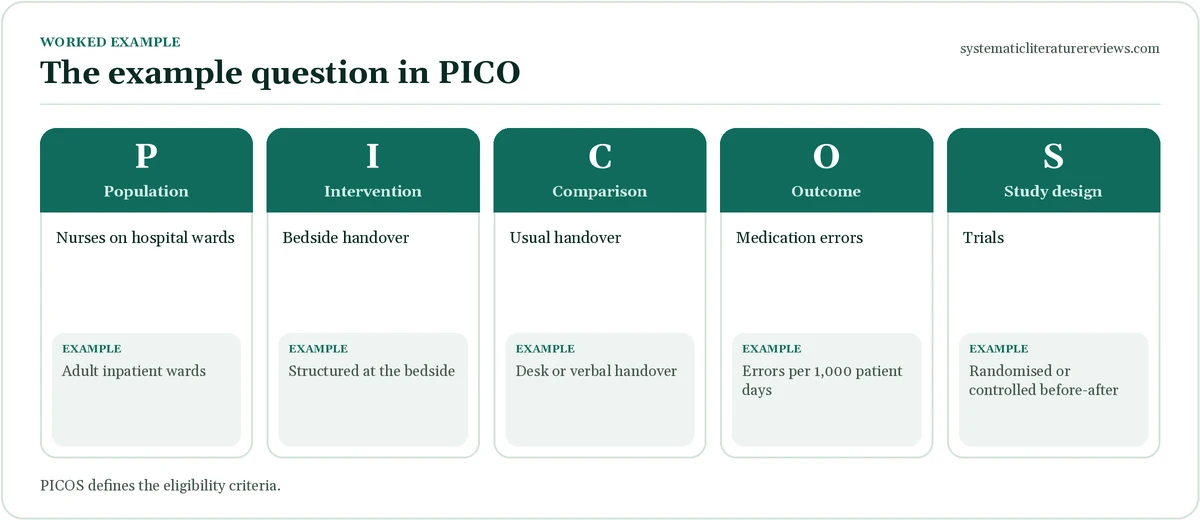
The review question was framed with PICO and a design element (PICOS).
| Element | Entry |
|---|---|
| Population | Nurses and patients on adult inpatient wards |
| Intervention | Structured bedside handover |
| Comparison | Desk or verbal handover without the patient |
| Outcome | Medication errors per 1,000 patient days |
| Study design | Randomised and controlled before-and-after studies |
The framework is explained in the PICO framework guide.
Step 2: the protocol
The protocol was written before the search.
- Registration: registered on PROSPERO (illustrative number).
- Criteria: adult wards, English, 2010 to 2025, error rate reported.
- Selection: two reviewers; conflicts resolved by a third.
- Appraisal: Cochrane RoB 2 for trials and ROBINS-I for other designs.
- Synthesis: random-effects meta-analysis of risk ratios if at least three comparable studies.
Step 3: the search
The search combined three concepts. See the literature search strategy and Boolean operators guides.
| Line | Search (MEDLINE, Ovid style) | Records |
|---|---|---|
| 1 | (“bedside handover” or “bedside report*” or “nursing handover”).ti,ab. | 1,480 |
| 2 | (medication error* or “drug error*” or “patient safety”).ti,ab. | 61,300 |
| 3 | 1 and 2 | 212 |
| 4 | Subject headings: exp Patient Handoff/ and exp Medication Errors/ | 190 |
| 5 | 3 or 4 (final set for this database) | 350 |
- Other sources: CINAHL and Embase were searched with equivalent strings; reference lists were checked.
- Total: 2,640 records across all sources before deduplication (illustrative).
Step 4: study selection and the flow numbers
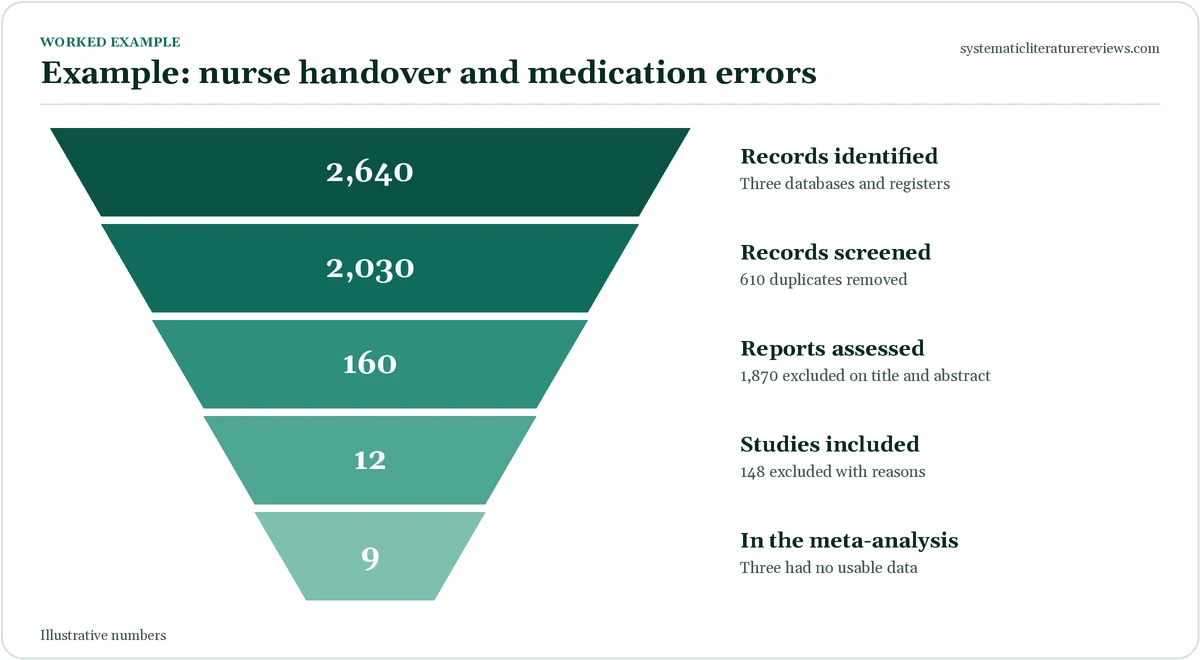
The numbers follow the PRISMA 2020 flow diagram. See the PRISMA flow diagram guide.
| Stage | Records |
|---|---|
| Identified from databases and registers | 2,640 |
| Duplicates removed | 610 |
| Screened on title and abstract | 2,030 |
| Excluded on title and abstract | 1,870 |
| Full texts assessed | 160 |
| Excluded at full text (wrong design 70, wrong setting 48, no error data 30) | 148 |
| Studies included | 12 |
Step 5: risk of bias
Each study was judged by two reviewers.
| Judgement | Studies |
|---|---|
| Low risk | 5 |
| Some concerns | 5 |
| High risk | 2 |
- Common concerns: lack of blinding of outcome assessors and incomplete follow-up.
- Sensitivity analysis: the pooled result was checked without high-risk studies.
- Report: a traffic-light figure and a table of judgements.
Step 6: data extraction
The form recorded design, setting, sample, intervention and results. Three studies reporting risk ratios are shown.
| Study | Design | Wards | Risk ratio | SE of ln(RR) |
|---|---|---|---|---|
| A (2018) | Randomised | 6 | 0.70 | 0.20 |
| B (2020) | Controlled before and after | 4 | 0.80 | 0.15 |
| C (2022) | Randomised | 8 | 0.60 | 0.25 |
Step 7: pooling the results
Risk ratios are pooled on the log scale with inverse-variance weights.
- Interpretation: bedside handover was associated with about a 27% lower rate of medication errors.
- Caution: three studies are few; the review should not claim more than moderate certainty.
- Learn more: see what is meta-analysis.
Writing the results
A short results paragraph from the example shows the style.
Writing the discussion
The discussion interprets the result and states limits.
- Summary: bedside handover probably reduces medication errors.
- Comparison: state how the finding compares with earlier reviews.
- Limits: few studies, short follow-up, differences in how errors were counted.
- Implications: wards could pilot bedside handover with audit of errors.
- Research: larger trials with night shifts and longer follow-up.
How to use this systematic review example
Use it as a model, not a source.
- Copy the structure: not the numbers.
- Replace the question: with your own and adjust the criteria.
- Check the reporting: against PRISMA 2020; see EQUATOR Network.
- See the report layout: in systematic literature review structure.
- Ask for help: with your own review via our order page.
What the example teaches
Several lessons come out of the walkthrough.
- Plan first: the protocol set the criteria before any searching.
- Count carefully: every number in the flow diagram was reconciled.
- Report reasons: full-text exclusions had stated reasons.
- Pool only comparable studies: three of 12 studies could be pooled.
- Be cautious: the conclusion stressed moderate certainty.
Summary of findings table (illustrative)
A summary of findings table gives the main result and its certainty in one place.
| Outcome | Studies | Result | Certainty | Reason |
|---|---|---|---|---|
| Medication errors | 3 trials | RR 0.73 (0.59 to 0.90) | Moderate | Some risk of bias |
| Handover time | 5 studies | Longer by 4 minutes per shift | Low | Inconsistency |
| Patient satisfaction | 4 studies | Higher with bedside handover | Low | Imprecision and risk of bias |
- Plain language: state the finding in a sentence.
- Downgrade: explain why certainty was lowered.
Reading the flow numbers
Each step in the flow diagram answers a question.
| Step | Question answered |
|---|---|
| Identification | How many records did we find? |
| Duplicates removed | How many were repeats? |
| Screening | How many were clearly irrelevant? |
| Full texts | How many met the criteria after reading? |
| Included | How many studies does the review use? |
Limits of the example review
Every review has limits. The example would state these.
- Few pooled studies: only three could be combined.
- Differences in error counting: studies defined errors differently.
- Short follow-up: most studies lasted under six months.
- Setting: all studies were in high-income countries.
- Publication bias: not testable with so few studies.
Adapting the example to your own topic
Use these steps to adapt the example.
- Change the PICOS: for your question.
- Rewrite the criteria: to fit your design and dates.
- Redo the search: with your concepts.
- Choose appraisal tools: suited to your designs.
- Decide the synthesis: narrative or meta-analysis.
For a deeper method, see what is a systematic literature review.
Extra detail: sensitivity analysis
A sensitivity analysis checks whether the result depends on certain decisions.
- Remove high-risk studies: the pooled risk ratio stayed close to 0.73.
- Change the model: a random-effects model gave the same estimate because heterogeneity was zero.
- Leave one out: removing each study in turn changed the result only slightly.
- Report: state what changed and what stayed the same.
Reading a forest plot for the example
A forest plot shows each study and the pooled result.
- Squares: show each study’s risk ratio; larger squares mean greater weight.
- Lines: show 95% confidence intervals.
- Diamond: shows the pooled estimate and its interval.
- Vertical line: at 1 marks no effect.
- In the example: all three squares sit left of 1, and the diamond (0.59 to 0.90) does not cross 1.
A reporting checklist for your own review
Use this list when you write your own review.
- Title: identifies the review type.
- Protocol: registered and cited.
- Search: strings and dates in an appendix.
- Flow diagram: with balanced numbers.
- Risk of bias: reported for every study.
- Certainty: rated for each outcome.
Where to find real systematic review examples
A real systematic review example is more useful than any invented one. Browse the Cochrane Library, open-access journals and your own database. Read each systematic review example with the PRISMA checklist beside you.
- Pick one on your topic: a recent, well-cited review.
- Mark the sections: methods, results and discussion.
- Compare: with this systematic review example to see what is similar.
- Learn the language: note how authors report numbers and limits.
Another systematic review example: a qualitative synthesis outline
Not every systematic review example pools numbers. This one synthesises qualitative studies.
| Item | Entry (illustrative) |
|---|---|
| Question | How do patients experience discharge from intensive care? |
| Framework | SPIDER |
| Search | CINAHL, MEDLINE, PsycINFO; 1,210 records |
| Included | 14 qualitative studies |
| Appraisal | CASP checklist; all rated moderate or high quality |
| Synthesis | Thematic synthesis with three themes: feeling unprepared, relying on family, regaining control |
| Confidence | CERQual: moderate for two themes, low for one |
- Difference: this systematic review example uses themes, not pooled numbers.
- Tools: see SPIDER framework for the question format.
Comparing the two systematic review example types
Each systematic review example fits a different question.
| Feature | Quantitative example | Qualitative example |
|---|---|---|
| Question | Does X reduce Y? | How do people experience X? |
| Studies | Trials and cohorts | Interviews and focus groups |
| Appraisal | RoB 2 or ROBINS-I | CASP |
| Synthesis | Meta-analysis | Thematic synthesis |
| Certainty | GRADE | GRADE-CERQual |
How long would this systematic review example take?
Even a small systematic review example takes time. For the example above, a team of two could expect the following.
| Stage | Time (illustrative) |
|---|---|
| Protocol and registration | 3 weeks |
| Searching and deduplication | 2 weeks |
| Screening 2,030 records | 4 weeks |
| Full texts, extraction and appraisal | 6 weeks |
| Synthesis and writing | 6 weeks |
- Total: about five months for a focused review.
- Larger reviews: take a year or more.
- Tip: screening tools and a clear protocol shorten each stage.
Frequently asked questions about systematic review example
Can I use this systematic review example as a source?
No. The question, numbers and results in this walkthrough are invented to show how the parts of a systematic review fit together, so they are not real evidence and should not be cited. You can use the structure, the wording of the sections and the calculations as models for your own review, replacing the question, criteria, search and results with your own. If you want real examples, look in the Cochrane Library, journals that publish systematic reviews or your own subject databases, and read them with a reporting checklist such as PRISMA beside you.
How many studies does a systematic review example need?
A systematic review can include any number of studies, from a handful to hundreds. This example included 12 studies, which is typical for a focused student review, and used three for the worked calculation to keep the arithmetic simple. What matters is that the search was comprehensive, the criteria were applied consistently and the number of included studies is reported honestly. If few studies exist, report that clearly and discuss what it means for the evidence and for future research.
Why did the example pool only three studies?
Meta-analysis requires studies that are similar enough in population, intervention, comparison and outcome, and that report data in a compatible form. In the example, only three of the 12 studies reported risk ratios for the same outcome, so only they could be pooled. The other studies were summarised narratively. In real reviews, authors decide in the protocol how they will choose studies to pool and report why some were left out, which reduces the risk of selecting studies to fit a desired result.
What does I-squared of zero mean in the example?
An I-squared of zero means that the observed differences between the three studies were no greater than expected by chance, so there is no evidence of heterogeneity. This is common when only a few studies are pooled, because the tests have low power and cannot detect small differences. It does not prove that the studies are identical, and the estimate should still be interpreted with care. In a real review you would also look at differences in design, setting and risk of bias, and report a prediction interval if a random-effects model is used.
Need expert help? Our experienced writers can handle the search, screening and write-up for you. Place your order in two minutes, or read how a systematic literature review works first.
Systematic Literature Reviews
Need a systematic literature review?
PRISMA-aligned searching, screening, appraisal and synthesis, written for your protocol.