
Blog
How To Conduct Cross-Sectional Quantitative Research Design

What is Cross-Sectional Quantitative Research Design in Quantitative Research Designs?
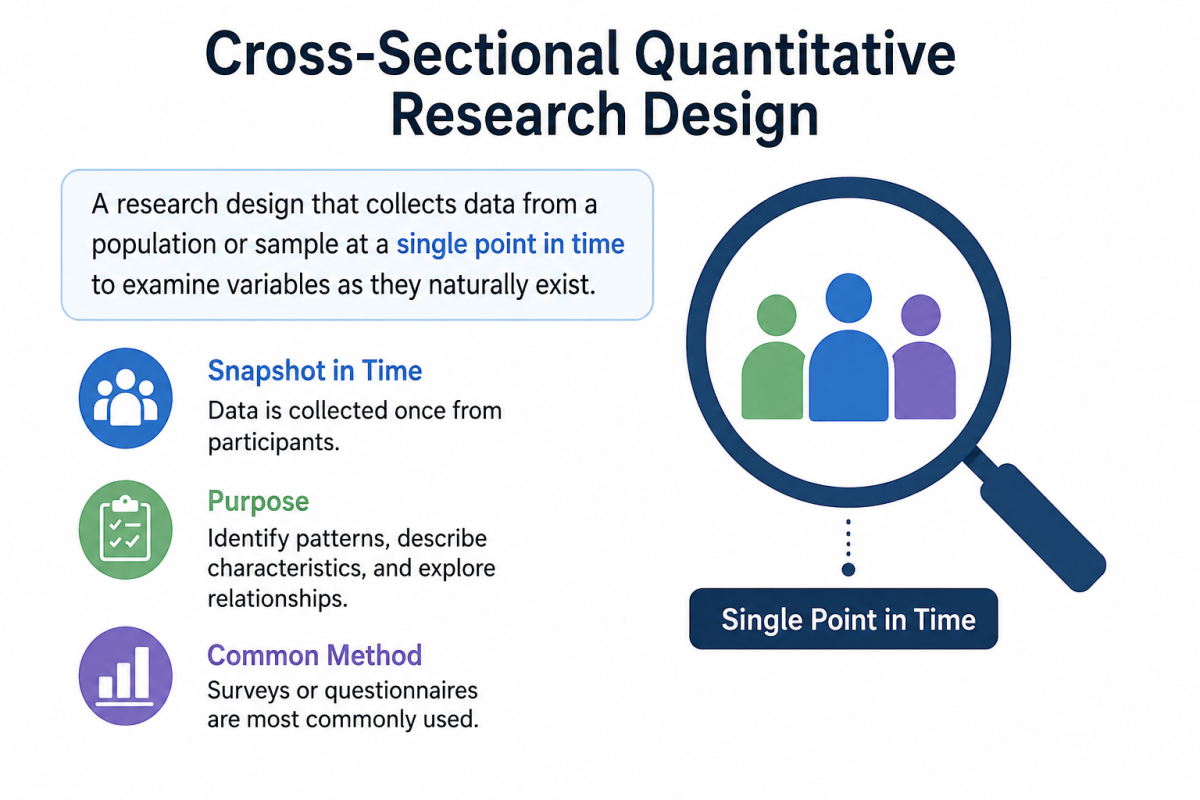
- A cross-sectional quantitative research design is a type of quantitative research design that examines a population, or a sample drawn from it, at a single point in time. Rather than tracking study participants over weeks, months, or years, researchers using this study design collect data once, producing what is often described as a “snapshot” of the variables being studied.
- It sits among several types of designs within quantitative methodology. While longitudinal and experimental designs follow participants across time or manipulate variables to test cause-and-effect, the cross-sectional study design simply observes and measures variables as they naturally exist at that single point in time. This makes it a purely observational study, with no intervention from the researcher.
- The core purpose is to identify patterns, not to prove causation. A cross-sectional design is used to identify patterns, describe characteristics of a population, and explore relationships between variables. For example, a researcher might want to know whether there is an association between screen time and sleep quality among teenagers. A cross-sectional study design can reveal whether such a correlation exists, but it cannot establish that one variable causes the other.
- Data collection typically relies on surveys or questionnaires. Cross-sectional surveys are among the most common data collection methods used in this design, since they allow researchers to gather data from a large number of study participants relatively quickly and at a reasonable cost. Other data collection methods include structured interviews, medical examinations, or existing records.
- It differs clearly from a cohort study or a longitudinal study. A cohort study or longitudinal study follows the same group of participants over an extended period to observe how variables change. A cross-sectional study design, by contrast, examines a population at a single point in time, making it faster and less resource-intensive, though limited in what conclusions it can support.
- It is widely used in epidemiology and public health. Researchers frequently use cross-sectional studies for estimating the prevalence of a disease, behavior, or condition within a population. For instance, public health researchers might use a cross-sectional quantitative research design to determine the prevalence of an outcome such as hypertension among adults in a specific region.
- There are two main forms worth knowing. A simple cross-sectional study captures data once, while a repeated cross-sectional study collects data from different samples of the same population at multiple time points, which can help researchers observe a trend over time without following the same individuals.
- In short, this research design offers a practical method of data collection for researchers who need a quick, cost-effective way to describe a population, generate a research question, or lay the groundwork for more rigorous longitudinal or experimental designs later on.
Philosophical Assumptions of The Cross-Sectional Quantitative Research Design
- Positivist foundations underpin the cross-sectional quantitative research design. Like most quantitative methodology, this study design rests on positivism, the philosophical assumption that reality is objective, measurable, and can be studied through observation and numerical data. Researchers using a cross-sectional design assume that variables, such as age, income, or health status, can be reliably quantified and analyzed.
- An epistemological assumption of objectivity guides the researcher. The cross-sectional quantitative research design assumes that the researcher can remain a neutral observer, collecting data without influencing the study participants or the outcome being measured. This is part of why the approach is classified as observational rather than experimental.
- Determinism is a quiet but important assumption. Quantitative research, including cross-sectional designs, generally assumes that events and behaviors have identifiable causes that can, in principle, be measured and analyzed statistically, even though a single cross-sectional study cannot establish a causal relationship on its own.
- The assumption of measurability shapes how a research question is framed. Before any data collection begins, the researcher must assume that the relevant variables, whether attitudes, behaviors, or biological markers, can be translated into numbers through tools such as a questionnaire or standardized testing instrument.
- Generalizability is assumed when sampling is appropriate. A cross-sectional quantitative research design typically assumes that if a sample is selected properly, findings can be generalized to the broader population from which study participants were drawn. This assumption is central to estimating the prevalence of a condition or behavior across a population.
- There is an assumption that a single time point can meaningfully represent reality. Because cross-sectional studies provide only a snapshot, researchers must assume that the single point in time chosen for data collection is reasonably representative and not skewed by a temporary or unusual circumstance, such as a seasonal illness outbreak or an atypical economic period.
- Researchers accept the limitation that correlation does not imply causation. A foundational philosophical position behind this study design is the understanding that while it can reveal an association between exposure and outcome, it cannot be used to establish a causal relationship the way experimental designs or carefully controlled longitudinal studies can.
- Value-neutrality is expected throughout the research process. As with most quantitative research, the researcher is expected to approach the research question, data collection, and analysis without allowing personal bias to shape the interpretation of relationships between variables, preserving the objectivity that gives quantitative findings their credibility.
- These assumptions matter for critical appraisal. When readers conduct a critical appraisal of a cross-sectional study, understanding these underlying philosophical assumptions helps clarify why the design is well suited to estimating prevalence and association, but poorly suited to establishing causal inference.
How To Conduct a Cross-Sectional Quantitative Research Design In 4 Easy Steps?
Step 1: Define the Research Question and Variables
- Start by clearly articulating the research question the study intends to answer. A well-formed research question identifies the population of interest, the variables to be measured, and the relationship the researcher hopes to explore.
- Identify the exposure and outcome variables. In a cross-sectional design, researchers typically measure both at the same time point, since there is no follow-up period to observe how one variable might influence another later on.
- Form a hypothesis, even though a cross-sectional study cannot confirm causal relationships. The hypothesis still gives the study direction and helps determine which variables across the population need to be measured.
- Decide whether the study will be a simple cross-sectional study or a repeated cross-sectional study, depending on whether the researcher wants a single snapshot or wants to track a trend across several distinct samples over time.
Step 2: Select the Study Design and Sampling Method
- Choose an appropriate cross-sectional study design, such as a descriptive cross-sectional study, which simply estimates the prevalence of an outcome, or an analytical cross-sectional study, which goes further to examine relationships between variables and test associations.
- Define the target population and determine how study participants will be selected. Common sampling methods include random sampling, stratified sampling, or convenience sampling, depending on resources and the nature of the research question.
- Determine the sample size needed to detect a meaningful association or accurately estimate prevalence, since a sample that is too small may fail to reveal a true relationship between variables.
- Consider demographic factors, such as age, gender, or socioeconomic status, that may need to be captured to allow for meaningful subgroup analysis later.
Step 3: Collect the Data
- Select reliable data collection methods. Cross-sectional surveys, questionnaires, structured interviews, and physical or clinical measurements are all common methods of data collection within this study design.
- Administer the questionnaire or survey to all study participants within a defined, relatively short data collection window, since the goal is to capture a single point in time rather than data spread across long intervals.
- Ensure the data collection instrument has been validated, particularly if the research is intended for publication or evidence-based practice, where measurement accuracy is closely scrutinized.
- Record demographic and contextual information alongside the primary variables, as this allows researchers to control for confounding factors during analysis.
Step 4: Analyze the Data and Interpret the Findings
- Use statistical methods appropriate for cross-sectional data, such as descriptive statistics for estimating prevalence, and correlation or regression analysis for exploring associations between variables.
- Calculate prevalence rates, since cross-sectional studies are particularly well suited for estimating the prevalence of a condition, behavior, or characteristic within a population at a single point in time.
- Interpret any observed association cautiously. Because the cross-sectional quantitative research design captures exposure and outcome simultaneously, researchers cannot establish a causal relationship and must frame conclusions in terms of association rather than causation.
- Report the findings clearly, noting that conclusions are limited to the single point in time observed, and that a longitudinal study or experimental design would be needed to explore causal relationships further.
What are the Advantages and Disadvantages of Cross-Sectional Quantitative Research Quantitative Research Designs?
Advantages
- Speed and efficiency. A What is Cross-Sectional Quantitative Research Design in Quantitative Research Designs?
- A cross-sectional quantitative research design is a type of quantitative research design that examines a population, or a sample drawn from it, at a single point in time. Rather than tracking study participants over weeks, months, or years, researchers using this study design collect data once, producing what is often described as a “snapshot” of the variables being studied.
- It sits among several types of designs within quantitative methodology. While longitudinal and experimental designs follow participants across time or manipulate variables to test cause-and-effect, the cross-sectional study design simply observes and measures variables as they naturally exist at that single point in time. This makes it a purely observational study, with no intervention from the researcher.
- The core purpose is to identify patterns, not to prove causation. A cross-sectional design is used to identify patterns, describe characteristics of a population, and explore relationships between variables. For example, a researcher might want to know whether there is an association between screen time and sleep quality among teenagers. A cross-sectional study design can reveal whether such a correlation exists, but it cannot establish that one variable causes the other.
- Data collection typically relies on surveys or questionnaires. Cross-sectional surveys are among the most common data collection methods used in this design, since they allow researchers to gather data from a large number of study participants relatively quickly and at a reasonable cost. Other data collection methods include structured interviews, medical examinations, or existing records.
- It differs clearly from a cohort study or a longitudinal study. A cohort study or longitudinal study follows the same group of participants over an extended period to observe how variables change. A cross-sectional study design, by contrast, examines a population at a single point in time, making it faster and less resource-intensive, though limited in what conclusions it can support.
- It is widely used in epidemiology and public health. Researchers frequently use cross-sectional studies for estimating the prevalence of a disease, behavior, or condition within a population. For instance, public health researchers might use a cross-sectional quantitative research design to determine the prevalence of an outcome such as hypertension among adults in a specific region.
- There are two main forms worth knowing. A simple cross-sectional study captures data once, while a repeated cross-sectional study collects data from different samples of the same population at multiple time points, which can help researchers observe a trend over time without following the same individuals.
- In short, this research design offers a practical method of data collection for researchers who need a quick, cost-effective way to describe a population, generate a research question, or lay the groundwork for more rigorous longitudinal or experimental designs later on.
- Philosophical Assumptions of The Cross-Sectional Quantitative Research Design
- Positivist foundations underpin the cross-sectional quantitative research design. Like most quantitative methodology, this study design rests on positivism, the philosophical assumption that reality is objective, measurable, and can be studied through observation and numerical data. Researchers using a cross-sectional design assume that variables, such as age, income, or health status, can be reliably quantified and analyzed.
- An epistemological assumption of objectivity guides the researcher. The cross-sectional quantitative research design assumes that the researcher can remain a neutral observer, collecting data without influencing the study participants or the outcome being measured. This is part of why the approach is classified as observational rather than experimental.
- Determinism is a quiet but important assumption. Quantitative research, including cross-sectional designs, generally assumes that events and behaviors have identifiable causes that can, in principle, be measured and analyzed statistically, even though a single cross-sectional study cannot establish a causal relationship on its own.
- The assumption of measurability shapes how a research question is framed. Before any data collection begins, the researcher must assume that the relevant variables, whether attitudes, behaviors, or biological markers, can be translated into numbers through tools such as a questionnaire or standardized testing instrument.
- Generalizability is assumed when sampling is appropriate. A cross-sectional quantitative research design typically assumes that if a sample is selected properly, findings can be generalized to the broader population from which study participants were drawn. This assumption is central to estimating the prevalence of a condition or behavior across a population.
- There is an assumption that a single time point can meaningfully represent reality. Because cross-sectional studies provide only a snapshot, researchers must assume that the single point in time chosen for data collection is reasonably representative and not skewed by a temporary or unusual circumstance, such as a seasonal illness outbreak or an atypical economic period.
- Researchers accept the limitation that correlation does not imply causation. A foundational philosophical position behind this study design is the understanding that while it can reveal an association between exposure and outcome, it cannot be used to establish a causal relationship the way experimental designs or carefully controlled longitudinal studies can.
- Value-neutrality is expected throughout the research process. As with most quantitative research, the researcher is expected to approach the research question, data collection, and analysis without allowing personal bias to shape the interpretation of relationships between variables, preserving the objectivity that gives quantitative findings their credibility.
- These assumptions matter for critical appraisal. When readers conduct a critical appraisal of a cross-sectional study, understanding these underlying philosophical assumptions helps clarify why the design is well suited to estimating prevalence and association, but poorly suited to establishing causal inference.
- How To Conduct a Cross-Sectional Quantitative Research Design In 4 Easy Steps?
- Step 1: Define the Research Question and Variables
- Start by clearly articulating the research question the study intends to answer. A well-formed research question identifies the population of interest, the variables to be measured, and the relationship the researcher hopes to explore.
- Identify the exposure and outcome variables. In a cross-sectional design, researchers typically measure both at the same time point, since there is no follow-up period to observe how one variable might influence another later on.
- Form a hypothesis, even though a cross-sectional study cannot confirm causal relationships. The hypothesis still gives the study direction and helps determine which variables across the population need to be measured.
- Decide whether the study will be a simple cross-sectional study or a repeated cross-sectional study, depending on whether the researcher wants a single snapshot or wants to track a trend across several distinct samples over time.
- Step 2: Select the Study Design and Sampling Method
- Choose an appropriate cross-sectional study design, such as a descriptive cross-sectional study, which simply estimates the prevalence of an outcome, or an analytical cross-sectional study, which goes further to examine relationships between variables and test associations.
- Define the target population and determine how study participants will be selected. Common sampling methods include random sampling, stratified sampling, or convenience sampling, depending on resources and the nature of the research question.
- Determine the sample size needed to detect a meaningful association or accurately estimate prevalence, since a sample that is too small may fail to reveal a true relationship between variables.
- Consider demographic factors, such as age, gender, or socioeconomic status, that may need to be captured to allow for meaningful subgroup analysis later.
- Step 3: Collect the Data
- Select reliable data collection methods. Cross-sectional surveys, questionnaires, structured interviews, and physical or clinical measurements are all common methods of data collection within this study design.
- Administer the questionnaire or survey to all study participants within a defined, relatively short data collection window, since the goal is to capture a single point in time rather than data spread across long intervals.
- Ensure the data collection instrument has been validated, particularly if the research is intended for publication or evidence-based practice, where measurement accuracy is closely scrutinized.
- Record demographic and contextual information alongside the primary variables, as this allows researchers to control for confounding factors during analysis.
- Step 4: Analyze the Data and Interpret the Findings
- Use statistical methods appropriate for cross-sectional data, such as descriptive statistics for estimating prevalence, and correlation or regression analysis for exploring associations between variables.
- Calculate prevalence rates, since cross-sectional studies are particularly well suited for estimating the prevalence of a condition, behavior, or characteristic within a population at a single point in time.
- Interpret any observed association cautiously. Because the cross-sectional quantitative research design captures exposure and outcome simultaneously, researchers cannot establish a causal relationship and must frame conclusions in terms of association rather than causation.
- Report the findings clearly, noting that conclusions are limited to the single point in time observed, and that a longitudinal study or experimental design would be needed to explore causal relationships further.
- What are the Advantages and Disadvantages of Cross-Sectional Quantitative Research Quantitative Research Designs?
- Advantages
- Speed and efficiency. A cross-sectional quantitative research design allows researchers to collect data relatively quickly since there is no need to follow study participants over an extended period, unlike a cohort study or longitudinal study.
- Cost-effectiveness. Because data collection happens at a single point in time, this study design generally requires fewer resources than longitudinal or experimental designs, making it attractive for researchers working with limited budgets or timelines.
- Useful for estimating prevalence. Cross-sectional designs are used to identify patterns and are especially valuable for estimating the prevalence of a disease, behavior, or attitude within a population, which is central to many public health and epidemiology studies.
- Multiple variables can be studied at once. Researchers can examine several variables and relationships between variables in a single study, making it possible to generate multiple research questions or hypotheses for future, more targeted investigation.
- No attrition problem. Since participants are only measured once, researchers avoid the dropout or loss-to-follow-up issues that often complicate cohort studies and longitudinal research.
- Useful starting point for further research. A cross-sectional study design can help researchers identify an association worth exploring further with a more rigorous longitudinal or experimental design, making it a practical first step in a broader research methodology.
- Ethical simplicity. Because the design is purely observational and involves no intervention, it generally raises fewer ethical concerns than experimental designs, which often require manipulating an exposure or treatment.
- Large sample sizes are achievable. Researchers can often gather data from a much larger population at a single point in time than would be feasible in a longitudinal study, improving statistical power for detecting an association.
- Disadvantages
- Cannot establish causal relationships. The most significant limitation is that a cross-sectional quantitative research design cannot establish a causal relationship between variables. Because exposure and outcome are measured simultaneously, it is often unclear which came first.
- Susceptible to reverse causation. Without a time point sequence, researchers cannot determine whether the exposure led to the outcome or whether the outcome influenced the exposure, complicating causal inference.
- Limited insight into trends. Since data are collected at a single point in time, a simple cross-sectional study cannot reveal how variables change, making it unsuitable for studying a trend unless a repeated cross-sectional approach is used.
- Vulnerable to confounding variables. Other unmeasured variables may influence the observed association, and without careful statistical control, researchers may draw misleading conclusions about the relationship between variables.
- Prevalence-incidence bias. Cross-sectional studies measure prevalence rather than incidence, meaning they capture existing cases rather than new occurrences, which can distort understanding of disease patterns, especially for conditions with short duration.
- Recall bias in retrospective data. When data collection relies on participants recalling past behaviors or exposures, retrospective reporting errors can distort the accuracy of the findings.
- Not ideal for rare conditions. Estimating the prevalence of rare outcomes within a population at a single point in time often requires impractically large sample sizes, making cross-sectional designs less efficient for such research questions.
- Generalizability concerns. If the sample is not representative of the broader population, findings from cross-sectional surveys may not generalize well, undermining the strength of conclusions drawn in evidence-based practice.
- Examples of Cross-Sectional Quantitative Research Design
- National health and nutrition surveys. Government health agencies often use a cross-sectional study design to estimate the prevalence of conditions such as obesity, diabetes, or hypertension within a population at a single point in time, providing a snapshot used to guide public health policy.
- Studies on pregnant women and maternal health. Researchers frequently use cross-sectional surveys to examine health behaviors, nutritional status, or healthcare access among pregnant women, offering insight into maternal and child health outcomes within a defined time point.
- Workplace satisfaction and demographic studies. Organizations commonly conduct cross-sectional research to explore the relationship between job satisfaction and demographic variables such as age, tenure, or department, gathering data through an internal questionnaire distributed to employees at one time.
- Census-based research. A census itself is a classic example of cross-sectional study design, capturing demographic, economic, and social data about an entire population at a single point in time, which researchers can later use to study relationships between variables such as income and education.
- Academic research on student wellbeing. University researchers often conduct cross-sectional surveys among students to examine the association between study habits, stress levels, and academic performance, providing useful findings without the time and cost of a longitudinal study.
- Analytical cross-sectional study on lifestyle and disease. An analytical cross-sectional study might examine the association between smoking and respiratory illness within a population, comparing the prevalence of the illness among smokers and non-smokers at the same point in time, though such findings, as noted in resources like SAGE research methods guides and university libguides on research design, cannot establish causal relationships.
- Repeated cross-sectional studies on social attitudes. Surveys tracking public opinion on social or political issues over several years, using new samples each time, exemplify a repeated cross-sectional approach. This allows researchers to observe a broader trend over time without the complexity of following the same study participants, unlike a true longitudinal design.
- Case-control adjacent research in epidemiology. While distinct from case-control studies, cross-sectional designs are sometimes used alongside them in epidemiology to first identify the prevalence of an outcome before a more targeted case-control or cohort study is designed to investigate causation further.
- Social science research on life expectancy and demographic factors. Researchers in the social sciences often use cross-sectional quantitative research design to explore how demographic factors, income, or geographic location relate to life expectancy, generating a greater understanding of public health disparities, as discussed in foundational methodology texts such as Setia and Bartlett’s work on study design.
- Retrospective workplace injury surveys. Some cross-sectional studies gather retrospective data, asking study participants to report past incidents, such as workplace injuries, to estimate incidence and prevalence within a given population, illustrating how this method of data collection can be applied beyond purely current observations.
- allows researchers to collect data relatively quickly since there is no need to follow study participants over an extended period, unlike a cohort study or longitudinal study.
- Cost-effectiveness. Because data collection happens at a single point in time, this study design generally requires fewer resources than longitudinal or experimental designs, making it attractive for researchers working with limited budgets or timelines.
- Useful for estimating prevalence. Cross-sectional designs are used to identify patterns and are especially valuable for estimating the prevalence of a disease, behavior, or attitude within a population, which is central to many public health and epidemiology studies.
- Multiple variables can be studied at once. Researchers can examine several variables and relationships between variables in a single study, making it possible to generate multiple research questions or hypotheses for future, more targeted investigation.
- No attrition problem. Since participants are only measured once, researchers avoid the dropout or loss-to-follow-up issues that often complicate cohort studies and longitudinal research.
- Useful starting point for further research. A cross-sectional study design can help researchers identify an association worth exploring further with a more rigorous longitudinal or experimental design, making it a practical first step in a broader research methodology.
- Ethical simplicity. Because the design is purely observational and involves no intervention, it generally raises fewer ethical concerns than experimental designs, which often require manipulating an exposure or treatment.
- Large sample sizes are achievable. Researchers can often gather data from a much larger population at a single point in time than would be feasible in a longitudinal study, improving statistical power for detecting an association.
Disadvantages
- Cannot establish causal relationships. The most significant limitation is that a cross-sectional quantitative research design cannot establish a causal relationship between variables. Because exposure and outcome are measured simultaneously, it is often unclear which came first.
- Susceptible to reverse causation. Without a time point sequence, researchers cannot determine whether the exposure led to the outcome or whether the outcome influenced the exposure, complicating causal inference.
- Limited insight into trends. Since data are collected at a single point in time, a simple cross-sectional study cannot reveal how variables change, making it unsuitable for studying a trend unless a repeated cross-sectional approach is used.
- Vulnerable to confounding variables. Other unmeasured variables may influence the observed association, and without careful statistical control, researchers may draw misleading conclusions about the relationship between variables.
- Prevalence-incidence bias. Cross-sectional studies measure prevalence rather than incidence, meaning they capture existing cases rather than new occurrences, which can distort understanding of disease patterns, especially for conditions with short duration.
- Recall bias in retrospective data. When data collection relies on participants recalling past behaviors or exposures, retrospective reporting errors can distort the accuracy of the findings.
- Not ideal for rare conditions. Estimating the prevalence of rare outcomes within a population at a single point in time often requires impractically large sample sizes, making cross-sectional designs less efficient for such research questions.
- Generalizability concerns. If the sample is not representative of the broader population, findings from cross-sectional surveys may not generalize well, undermining the strength of conclusions drawn in evidence-based practice.
Examples of Cross-Sectional Quantitative Research Design
- National health and nutrition surveys. Government health agencies often use a cross-sectional study design to estimate the prevalence of conditions such as obesity, diabetes, or hypertension within a population at a single point in time, providing a snapshot used to guide public health policy.
- Studies on pregnant women and maternal health. Researchers frequently use cross-sectional surveys to examine health behaviors, nutritional status, or healthcare access among pregnant women, offering insight into maternal and child health outcomes within a defined time point.
- Workplace satisfaction and demographic studies. Organizations commonly conduct cross-sectional research to explore the relationship between job satisfaction and demographic variables such as age, tenure, or department, gathering data through an internal questionnaire distributed to employees at one time.
- Census-based research. A census itself is a classic example of cross-sectional study design, capturing demographic, economic, and social data about an entire population at a single point in time, which researchers can later use to study relationships between variables such as income and education.
- Academic research on student wellbeing. University researchers often conduct cross-sectional surveys among students to examine the association between study habits, stress levels, and academic performance, providing useful findings without the time and cost of a longitudinal study.
- Analytical cross-sectional study on lifestyle and disease. An analytical cross-sectional study might examine the association between smoking and respiratory illness within a population, comparing the prevalence of the illness among smokers and non-smokers at the same point in time, though such findings, as noted in resources like SAGE research methods guides and university libguides on research design, cannot establish causal relationships.
- Repeated cross-sectional studies on social attitudes. Surveys tracking public opinion on social or political issues over several years, using new samples each time, exemplify a repeated cross-sectional approach. This allows researchers to observe a broader trend over time without the complexity of following the same study participants, unlike a true longitudinal design.
- Case-control adjacent research in epidemiology. While distinct from case-control studies, cross-sectional designs are sometimes used alongside them in epidemiology to first identify the prevalence of an outcome before a more targeted case-control or cohort study is designed to investigate causation further.
- Social science research on life expectancy and demographic factors. Researchers in the social sciences often use cross-sectional quantitative research design to explore how demographic factors, income, or geographic location relate to life expectancy, generating a greater understanding of public health disparities, as discussed in foundational methodology texts such as Setia and Bartlett’s work on study design.
- Retrospective workplace injury surveys. Some cross-sectional studies gather retrospective data, asking study participants to report past incidents, such as workplace injuries, to estimate incidence and prevalence within a given population, illustrating how this method of data collection can be applied beyond purely current observations.
