
Empirical Hypothesis: Definition and Examples

An empirical hypothesis is a prediction that can be checked against observation or measurement. It says what you expect to see in real data, so that evidence can support it or show it to be wrong.
This guide defines the term, explains the empirical cycle that produces it, gives five steps with an example at every step, compares it with other kinds of hypothesis, and shows a worked test with equations.
- The idea: what an empirical hypothesis is and where it comes from.
- The method: five steps from observation to a testable prediction.
- The test: examples, a worked example with equations and common mistakes.
On this page
Key takeaways
- An empirical hypothesis is a prediction that observation or measurement can support or contradict.
- It names measurable variables, a relationship and a population.
- The empirical cycle runs from observation to induction, deduction, testing and evaluation.
- Write the null hypothesis and the test before you collect data.
What is an empirical hypothesis?
It is a testable statement about what you expect to observe.
- Definition: a prediction about measurable events or relationships that data can confirm or contradict.
- Source: observation, earlier studies or theory, always tied to something you can measure.
- Contrast: a purely theoretical or logical claim is not tested directly with data.
- Wording: higher, lower, more likely, differs from, is associated with.
- Example: students who sleep five hours recall fewer words the next morning than students who sleep eight hours.
The empirical cycle
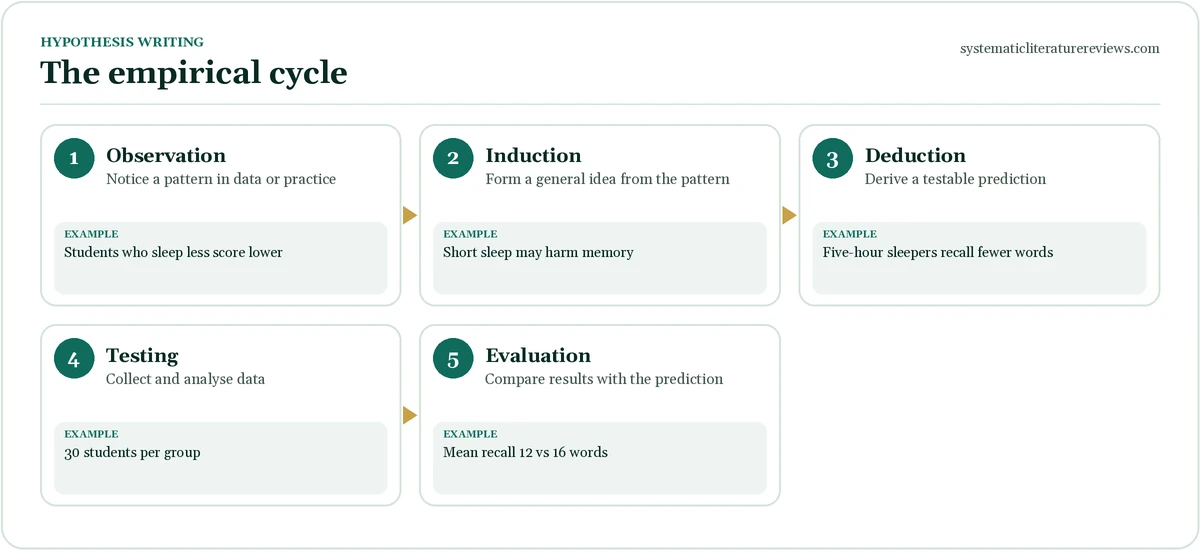
The Dutch psychologist Adriaan de Groot described the empirical cycle, which shows where an empirical hypothesis fits.
- Observation: collect facts and notice a pattern. Example: students who sleep less score lower.
- Induction: form a general idea from the pattern. Example: short sleep may harm memory.
- Deduction: derive a testable prediction. Example: five-hour sleepers recall fewer words.
- Testing: collect data and analyse it. Example: 30 students per group.
- Evaluation: compare results with the prediction and revise. Example: mean recall 12 against 16 words.
Empirical hypothesis vs other types of hypothesis
The table shows how the empirical hypothesis relates to its neighbours.
| Type | Main feature | Example |
|---|---|---|
| Empirical | Predicts an observable result | Five-hour sleepers recall fewer words |
| Logical | Follows from premises by reasoning | If sleep supports memory, short sleep lowers recall |
| Working | Provisional guide | Short sleep may harm memory |
| Null | States no effect | There is no difference in recall |
| Statistical | Claim about a population parameter | H0: μ1 = μ2 |
See the guides to the logical hypothesis, the working hypothesis and the statistical hypothesis.
Characteristics of a strong empirical hypothesis
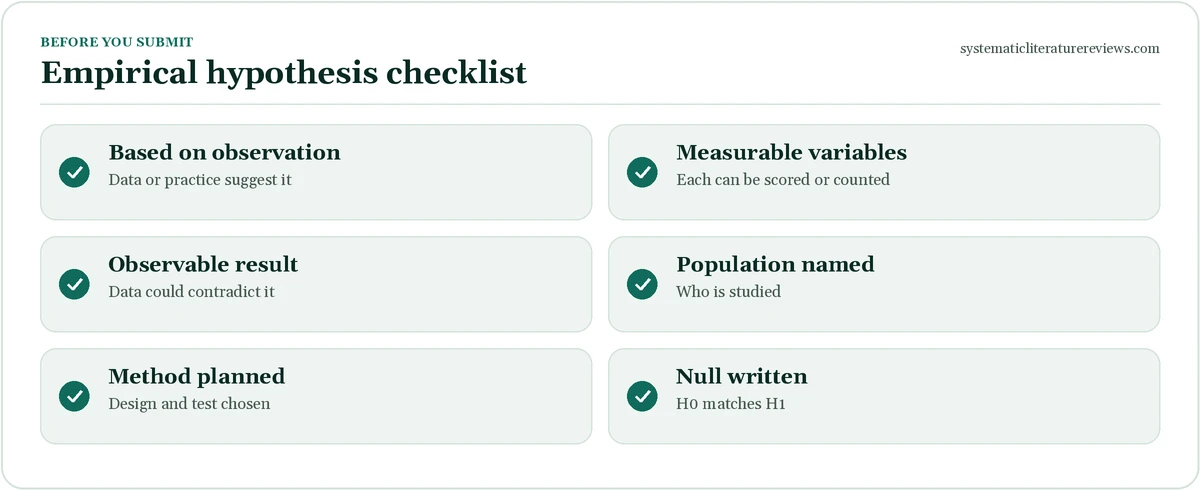
Check each point before you collect data.
- Observable: the outcome can be seen, counted or measured.
- Specific: variables, direction and population are named.
- Falsifiable: some result would show it is wrong.
- Grounded: observations or earlier studies support it.
- Feasible: you can collect the data with your time and resources.
- Clear: one sentence an examiner can follow.
Step-by-step guide to writing an empirical hypothesis
Follow these five steps. Each has an explanation and an example.
- Start with an observation. Describe a pattern you have seen in data or practice, as plainly as you can. Example: Students who report short sleep score lower in morning tests.
- Name measurable variables. Choose two variables and say how you will measure each, including the unit. Example: Hours of sleep from a diary; number of words recalled out of 30.
- Write the prediction. State what you expect to observe, with direction and population. Example: First-year students who sleep five hours recall fewer words than those who sleep eight hours.
- Write the null hypothesis. State no difference so that a test can reject it. Example: H0: mean recall is the same in the two groups.
- Plan the test. Choose the data, the sample size and the statistical test before you collect anything. Example: 30 per group; independent-samples t test; α = 0.05.
Empirical hypothesis examples
Each example names measurable variables and a population.
| Field | Empirical hypothesis |
|---|---|
| Nursing | Patients who are repositioned every two hours develop fewer pressure ulcers than patients repositioned every four hours. |
| Education | Students who take weekly quizzes score higher on the final exam than students who do not. |
| Business | Teams that hold daily stand-up meetings complete more tasks per week than teams that do not. |
| Psychology | Adolescents who use social media for more than three hours a day report shorter sleep than those who use it for less. |
| Public health | Adults who receive a text-message reminder are more likely to be vaccinated within 30 days than adults who do not. |
A worked empirical hypothesis example with equations
The numbers are invented to show how a prediction meets data.
- Hypothesis: adults who receive a text reminder are more likely to be vaccinated within 30 days than adults who do not.
- Null: p1 = p2, where p is the proportion vaccinated.
- Data: 200 adults per group; 30 per cent vaccinated with the reminder and 20 per cent without.
- Test: two-proportion z test, two-tailed, α = 0.05.
- Effect size: a 10 percentage-point difference; the odds ratio is (0.30/0.70)/(0.20/0.80) = 1.71.
- Report: z = 2.31, p = .021; 30% vs 20%, OR = 1.71.
- Caution: without random assignment the difference could reflect other factors.
Common mistakes with the empirical hypothesis
Check your hypothesis against this list.
- Not measurable: students will be happier. Example: name a scale and a score.
- Not falsifiable: some effect will occur. Example: state what result would contradict it.
- Written after the results: this is hindsight. Example: record it before data collection.
- Too many ideas: one hypothesis tests several effects. Example: split it.
- Cause without design: a survey cannot show cause. Example: use associated with.
Operational definitions: making an empirical hypothesis measurable
An empirical hypothesis becomes testable when each concept has an operational definition, which says exactly how it will be measured.
| Concept | Weak wording | Operational definition |
|---|---|---|
| Sleep | Enough sleep | Hours slept, from a daily diary, averaged over seven nights |
| Memory | Good memory | Number of words recalled from a list of 30 after a 10-minute delay |
| Stress | Feeling stressed | Score on the Perceived Stress Scale, 0 to 40 |
| Exercise | Active people | Minutes of moderate exercise per week from an accelerometer |
| Vaccination | Protected | Received at least one dose within 30 days |
- Why it matters: another researcher can repeat your measurement.
- Validity: choose measures with evidence that they capture the concept.
- Reliability: prefer measures that give consistent results.
Matching the design to the hypothesis
The design decides what your empirical hypothesis can claim.
| Design | What it can test | Typical wording |
|---|---|---|
| Randomised experiment | Cause and effect | Participants assigned to the reminder will be vaccinated more often |
| Quasi-experiment | Effect without random assignment | Wards that adopt the checklist will have fewer falls |
| Cohort study | Predictors of later outcomes | Smokers will develop chronic cough more often |
| Cross-sectional survey | Association at one time | Sleep duration is associated with test score |
| Case-control | Past exposure in cases and controls | Cases were more likely to report the exposure |
Choose between associative and causal wording using the guides to associative hypotheses and causal hypotheses.
Planning a sample for your empirical hypothesis
A hypothesis can only be tested fairly if the sample is large enough to detect the effect you expect.
- Compare: the earlier example used 200 per group and found p = .021, so it was lucky; a plan for 288 per group is safer.
- Use software: G*Power or R can do the calculation.
- Report: alpha, power and the effect you wanted to detect.
Pre-registering and reporting your empirical hypothesis
Writing your hypothesis down before you see the data protects the integrity of the result.
- Pre-register: record the hypothesis, the measures and the test on a platform such as the Open Science Framework.
- Label exploratory analyses: results you did not predict are useful but must be reported as exploratory.
- Report all tests: state every test you ran, not only the significant ones.
- Give effect sizes: report the size of the difference with a confidence interval, not only the p value.
- Share data: where ethics allow, share materials so others can check your work.
Tips for strong empirical hypotheses in a thesis
These habits help examiners trust your work.
- Link to the literature: explain which earlier findings suggest your prediction.
- Number your hypotheses: H1, H2 and H3 make the results chapter easier to follow.
- Match each to a test: list the variable, the test and the decision rule in a table.
- Keep the null in view: state it in the methods and refer to it in the results.
- Be honest about null results: a result that does not support your hypothesis still adds knowledge.
For the null form itself, see the guide to the null hypothesis.
Empirical hypotheses in different research traditions
The idea appears in many fields, with different wording.
- Natural science: predictions are tested in controlled experiments.
- Social science: predictions about groups are tested with surveys and quasi-experiments.
- Health research: predictions about treatment effects are tested in trials.
- Economics: predictions from models are tested with observational data.
- Computing: predictions about system performance are tested with benchmarks.
Whatever the field, the hypothesis must be tied to evidence.
Empirical hypotheses and the scientific method
An empirical hypothesis is one stage in a wider process of inquiry.
- Falsifiability: Karl Popper argued that scientific claims should be open to refutation; a good empirical hypothesis states what would count against it.
- Replication: another team should be able to repeat your measurement and test.
- Cumulative evidence: a single study seldom settles a question, so hypotheses are tested again in new samples.
- Revision: when data contradict the prediction, you revise the theory, the measure or the design.
- Transparency: record all decisions, from the first observation to the final test.
More pitfalls when moving from idea to test
These problems appear in many student projects.
- Fishing for results: running many tests until one is significant inflates false positives. Example: correct for multiple tests or pre-register one primary test.
- Weak measures: a single question for a complex concept may not be valid. Example: use a published scale.
- Tiny samples: a small sample cannot detect a modest effect. Example: calculate sample size first.
- Ignoring confounders: other variables may explain the difference. Example: measure and adjust for them.
- Overstating results: a significant result is not proof. Example: report effect sizes and limits.
Writing the empirical hypothesis in your thesis
Place the hypothesis where readers expect it.
- Literature review: end with the gap and the prediction it suggests.
- Methods: restate each hypothesis with its variables, measures and test.
- Results: report each hypothesis in order, with the statistic, p value and effect size.
- Discussion: say whether each hypothesis was supported and what that means.
- Conclusion: summarise what the evidence adds and what remains uncertain.
Related hypothesis guides
Hypotheses come in several forms, and a study often uses more than one. This table links to every hypothesis guide in our library so that you can move between them.
| Guide | What it covers |
|---|---|
| Null hypothesis | States that there is no difference or relationship |
| Alternative hypothesis | States that there is a difference or relationship |
| Research hypothesis | The prediction your study is designed to test |
| Directional hypothesis | Predicts which way an effect points |
| Non-directional hypothesis | Predicts a difference without naming the direction |
| Simple hypothesis | One independent and one dependent variable |
| Complex hypothesis | Two or more independent or dependent variables |
| Associative hypothesis | Predicts that variables change together |
| Causal hypothesis | Predicts that one variable produces change in another |
| Statistical hypothesis | A claim about a population parameter that a test can assess |
| Logical hypothesis | A reasoned proposition based on theory or argument |
| Value hypothesis | Concerns values, preferences or what ought to be |
| Declarative hypothesis | A clear statement of the expected result |
| Question-form hypothesis | A hypothesis worded as a question |
| Working hypothesis | A provisional hypothesis that guides early work |
| Testable hypothesis | A claim that data could support or contradict |
| Types of hypotheses | An overview of every type, with examples |
| How to write a hypothesis | Step-by-step writing guide |
| Hypothesis examples | Thirty worked examples by field |
For question-writing, see the guide to FINER research questions and the sample research questions.
Frequently asked questions about empirical hypothesis
What is an empirical hypothesis?
An empirical hypothesis is a testable prediction about something that can be observed or measured, such as the number of words students recall after different amounts of sleep. It comes from observation, earlier studies or theory, and it names variables, a relationship and a population so that data can support it or contradict it. It is usually paired with a null hypothesis and a statistical test. A hypothesis that cannot be checked against observation, for example because its terms are not measurable, is not empirical.
How is an empirical hypothesis different from a theoretical one?
A theoretical hypothesis follows from theory or reasoning and may deal with concepts that are not directly measured, while an empirical hypothesis states what you expect to observe in real data. In practice, researchers move between the two: a theory suggests a prediction, which is expressed as an empirical hypothesis, and the data then support or weaken the theory. If your hypothesis cannot be tied to a measurable variable and a study design, it needs more work before it can be tested.
What is the empirical cycle?
The empirical cycle, described by Adriaan de Groot, is a model of how research proceeds. It starts with observation, moves to induction, in which you form a general idea, then deduction, in which you derive a testable prediction, then testing with data, and finally evaluation, where you compare results with the prediction and revise your ideas. The empirical hypothesis is produced at the deduction stage. The cycle can repeat, so that each study leads to refined questions and new predictions that can be tested in later work.
Do qualitative studies use empirical hypotheses?
Many qualitative studies are exploratory and do not state formal hypotheses, because their aim is to understand meaning or process rather than to test a prediction. Some, such as case studies, use propositions to guide data collection. All qualitative work is empirical in the broad sense because it relies on observation or interviews, but the term empirical hypothesis usually refers to a precise, testable prediction. If your design is qualitative, use research questions unless your supervisor or field expects hypotheses.
Need expert help? Our experienced writers can handle the search, screening and write-up for you. Place your order in two minutes, or read how a systematic literature review works first.
Systematic Literature Reviews
Need help writing your hypothesis?
Clear, testable hypotheses matched to your design and statistics.