
Blog
How To Write Statistical Hypothesis With Examples
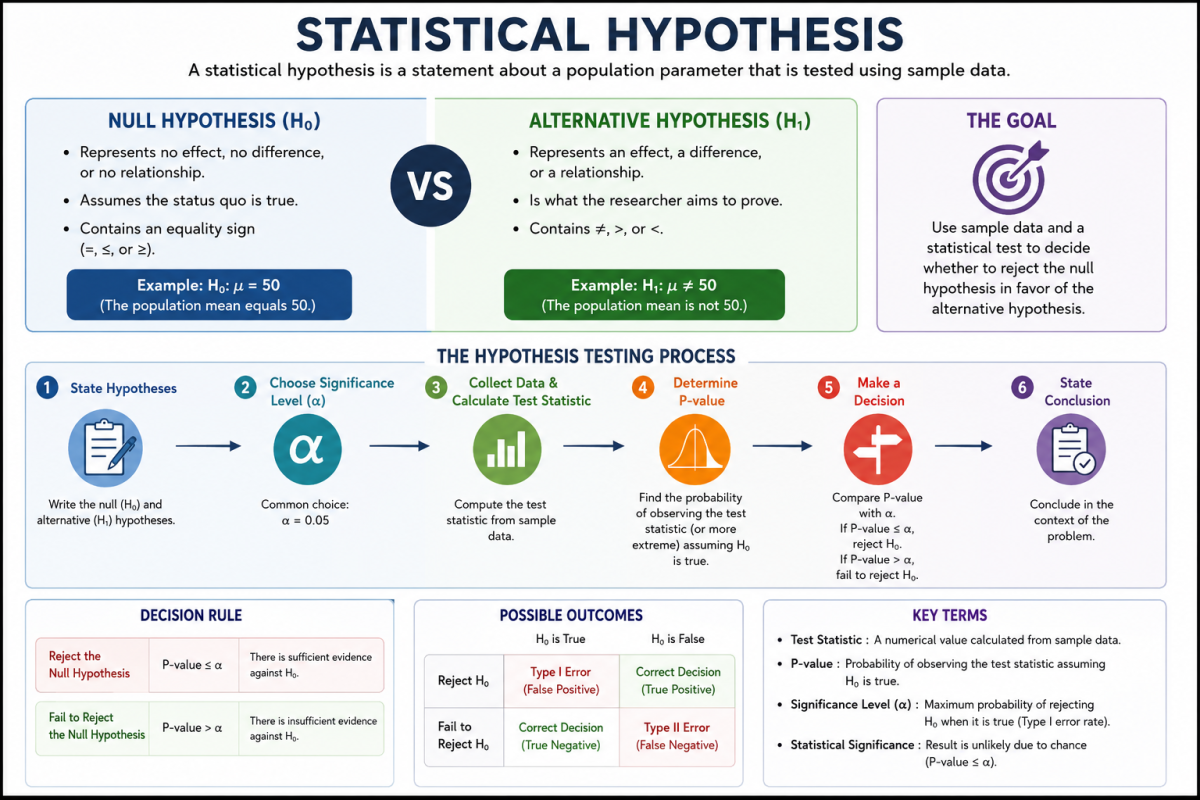
What Is a Statistical Hypothesis? Definition and Importance in Statistical Hypothesis Testing
- A Statistical Hypothesis is a statement about a population parameter that researchers evaluate using data collected from a sample.
- In simple terms, a hypothesis is an assumption or claim that can be examined through a statistical hypothesis test.
- The hypothesis is that a population possesses certain characteristics, such as a specific mean, proportion, or relationship between variables.
- A Statistical Hypothesis helps researchers make decisions based on statistical evidence rather than personal opinions.
Definition of Statistical Hypothesis
- A Statistical Hypothesis is a formal hypothesis statement used in inferential statistics.
- It allows researchers to conduct statistical analysis and determine whether observed results occurred by chance.
- Statistical hypotheses are central to modern hypothesis testing because they provide a structured framework for testing hypotheses.
Components of a Statistical Hypothesis
- Every statistical hypothesis testing process contains:
- A null hypothesis and alternative hypothesis.
- A selected significance level.
- A suitable statistical test.
- A calculated test statistic.
- A final decision based on statistical significance.
Why Statistical Hypothesis Testing Plays an Important Role
- Statistical hypothesis testing plays a major role in scientific research, business studies, medicine, psychology, economics, and social sciences.
- It supports statistical inference by allowing researchers to draw conclusions about populations using sample data.
- Understanding hypothesis testing and statistical principles helps researchers avoid making unsupported claims.
- The application of hypothesis testing helps determine which hypothesis receives support from the available data.
- Statistical methods provide objective procedures for evaluating research hypotheses.
- Modern significance testing has become one of the most widely used statistical practices in research.
Importance of Statistical Hypothesis Testing
- Helps determine whether differences or relationships are statistically significant.
- Provides statistical evidence for decision-making.
- Reduces bias in research.
- Supports reliable statistical analysis.
- Enables researchers to compare a difference between two groups.
- Improves the accuracy of conclusions obtained from inferential statistics.
- Provides consistency in performing hypothesis testing.
Example
Suppose a teacher believes students score an average of 75 marks.
- Null hypothesis in this case: H₀: μ = 75
- Alternative hypothesis: H₁: μ ≠ 75
Researchers then perform a statistical hypothesis test to determine whether the null hypothesis is true or whether there is evidence against the null hypothesis.
How To Write Statistical Hypothesis With Examples: A 7-Step Process for Formulating Null and Alternative Hypotheses
Creating the correct hypothesis becomes easier when following a systematic hypothesis testing method.
Step 1: Define the Research Question
- Begin by making a hypothesis based on a clear problem.
- Identify exactly what you want to investigate.
- Your research hypotheses should focus on measurable variables.
Example:
“Does exercise improve exam scores?”
Step 2: Identify the Population Parameter
- Determine whether the hypothesis is that a population mean, proportion, or variance has changed.
- Select the statistic you want to test.
Examples include:
- Population mean.
- Population proportion.
- Difference between two groups.
Step 3: Write the Null Hypothesis
- The null hypothesis is usually written with an equality sign.
- Assuming the null hypothesis means treating the claim as true until evidence suggests otherwise.
- The null hypothesis is valid unless sufficient evidence against the null hypothesis exists.
Example:
H₀: Average exam score = 70
Step 4: Write the Alternative Hypothesis
- The alternative hypothesis represents the claim researchers hope to support.
- The alternative hypothesis is true if sufficient evidence shows the null hypothesis is false.
- The null and alternative hypotheses must be mutually exclusive.
Example:
H₁: Average exam score > 70
Step 5: Choose the Statistical Test
Different statistical test procedures are available depending on the data.
Common choices include:
- t-test.
- z-test.
- Chi-square test.
- ANOVA.
- Correlation test.
Selecting the proper test for the hypothesis ensures reliable results.
Step 6: Select the Significance Level
- The significance level represents the probability of rejecting the null when the true null hypothesis actually exists.
- Researchers commonly use a significance level of 0.05.
- According to the American Statistical Association, statistical significance should not be the only factor guiding conclusions.
Step 7: Analyze Results and Make a Decision
After calculating the test statistic:
- Reject the null hypothesis if the p-value is less than the level of significance.
- Fail to reject the null if evidence is insufficient.
- Researchers generally avoid saying they “accept the null hypothesis” because the null hypothesis is not rejected rather than proven true.
Possible outcomes include:
- Null hypothesis is rejected.
- Null hypothesis is not rejected.
- Accept the alternative hypothesis.
- Fail to reject the null.
The results of a hypothesis test provide guidance for decision-making.
How To Write Statistical Hypothesis With Examples for Different Statistical Tests
Different statistical methods require different forms of hypothesis statements.
1. One-Sample t-Test
Used when comparing one sample mean with a population mean.
Example:
- H₀: μ = 50
- H₁: μ ≠ 50
This statistical hypothesis evaluates whether the sample differs from the known population average.
2. Two-Sample t-Test
Used for comparing a difference between two groups.
Example:
- H₀: μ₁ = μ₂
- H₁: μ₁ ≠ μ₂
This Statistical Hypothesis helps determine whether two treatments produce different outcomes.
3. Paired t-Test
Used when observations come from the same subjects before and after treatment.
Example:
- H₀: Mean difference = 0
- H₁: Mean difference ≠ 0
4. Chi-Square Test
Used for categorical variables.
Example:
- H₀: Variables are independent.
- H₁: Variables are associated.
5. Correlation Test
Used to examine relationships between variables.
Example:
- H₀: ρ = 0
- H₁: ρ ≠ 0
6. ANOVA Test
Used when comparing three or more groups.
Example:
- H₀: All means are equal.
- H₁: At least one mean differs.
Each Statistical Hypothesis should correspond to the selected statistical test and research objective.
Common Types of Statistical Hypotheses and Frequentist Hypothesis Approaches
Several forms of statistical hypotheses exist depending on the study design.
1. Null Hypotheses
- State that no effect or difference exists.
- Assume the null hypothesis is true at the beginning of analysis.
- Thus the null hypothesis becomes the reference point for statistical inference.
Example:
“There is no relationship between exercise and weight loss.”
2. Alternative Hypothesis
- Indicates an effect, difference, or relationship exists.
- Researchers seek statistical evidence supporting this claim.
Example:
“Exercise affects weight loss.”
3. Directional Hypothesis
- Specifies the direction of the expected effect.
Example:
“Students receiving tutoring score higher.”
4. Non-Directional Hypothesis
- Predicts a difference without specifying the direction.
Example:
“Student scores differ between teaching methods.”
5. Simple Hypothesis
- Contains one independent variable and one dependent variable.
6. Complex Hypothesis
- Involves multiple variables.
Frequentist Hypothesis Approach
The frequentist hypothesis framework forms the basis of null hypothesis significance testing.
Key principles of hypothesis testing under this approach include:
- Assuming the null hypothesis initially.
- Computing a test statistic.
- Evaluating probability values.
- Comparing results with the significance level.
- Determining whether the null hypothesis is to be rejected.
Type I and Type II Errors
The two types of errors are important in understanding statistical errors.
Type I Error
- Occurs if the null hypothesis is rejected even though the true null hypothesis exists.
- A type I error means the null hypothesis is rejected even when the null hypothesis is valid.
- The probability of rejecting the null incorrectly equals the significance level.
Type II Error
- Occurs if the null hypothesis is false but researchers fail to reject the null.
- This error prevents correctly rejecting the null hypothesis.
Statistical Power
- Statistical power refers to the probability of correctly rejecting the null hypothesis when the alternative hypothesis is true.
- Larger sample size generally increases statistical power.
- High power reduces errors in hypothesis testing.
Multiple Testing Considerations
- Performing multiple testing increases the chance of statistical errors.
- Researchers must use proper statistical practices when conducting numerous comparisons.
Important Reminder
Researchers should avoid claiming:
- “The hypothesis is accepted.”
- “The null hypothesis is true.”
Instead, modern hypothesis testing recommends stating:
- Null hypothesis is not rejected.
- There is insufficient evidence against the null hypothesis.
- Statistical significance was or was not achieved.
These principles form the foundation of modern significance testing and ensure reliable statistical analysis.
Null Hypotheses vs Alternative Hypothesis: When to Reject the Null Hypothesis or Fail to Reject the Null
Understanding the relationship between the null hypothesis and alternative hypothesis is one of the most important parts of a Statistical Hypothesis. Every statistical hypothesis test relies on these two competing statements.
What Is a Null Hypothesis?
- The null hypothesis represents the assumption that no effect, difference, or relationship exists.
- In statistical terms, researchers begin by assuming the null hypothesis before analyzing the data.
- Thus the null hypothesis serves as the starting point in modern hypothesis testing.
- The null hypothesis is true unless enough statistical evidence suggests otherwise.
- Most null hypotheses contain an equal sign (=, ≤, or ≥).
Example:
Suppose researchers want to determine whether a new diet changes average weight loss.
- Null hypothesis in this case: H₀: Average weight loss = 10 pounds
- The hypothesis is that a population has not changed from the expected value.
What Is an Alternative Hypothesis?
- The alternative hypothesis represents the claim that researchers hope to support.
- It states that an effect, difference, or relationship exists.
- The alternative hypothesis is true when sufficient evidence against the null hypothesis is obtained.
- The null and alternative hypotheses cannot both be correct at the same time.
Example:
- H₁: Average weight loss ≠ 10 pounds
Major Differences Between Null and Alternative Hypotheses
Null Hypothesis
- Assumes no difference exists.
- Forms the basis for testing hypotheses.
- Used in null hypothesis significance testing.
- Represents the status quo.
Alternative Hypothesis
- Suggests a difference exists.
- Provides the research expectation.
- Supports research hypotheses.
- Represents the outcome researchers are investigating.
When to Reject the Null Hypothesis
Researchers would reject the null hypothesis when:
- The calculated probability is lower than the selected significance level.
- The test statistic falls into the rejection region.
- Strong statistical evidence exists.
- Results are statistically significant.
When the null hypothesis is rejected:
- Researchers may accept the alternative hypothesis.
- The results of a hypothesis test suggest that the null hypothesis is false.
- Statistical inference indicates that the observed effect is unlikely to occur if the null hypothesis is true.
When to Fail to Reject the Null
Researchers fail to reject the null when:
- Evidence against the null hypothesis is weak.
- The p-value exceeds the level of significance.
- Statistical significance is not achieved.
When the null hypothesis is not rejected:
- Researchers do not prove that the true null hypothesis exists.
- They simply conclude that available evidence is insufficient.
- Many beginners mistakenly say they “accept the null hypothesis.” In reality, modern significance testing recommends stating that the null hypothesis is not rejected.
Can We Accept the Null Hypothesis?
- Traditional statistical practices discourage saying that we accept the null hypothesis.
- Instead, researchers usually say:
- Fail to reject the null.
- Insufficient statistical evidence exists.
- Whether the null hypothesis is true cannot be determined with certainty.
Important Reminder
A hypothesis is rejected even though the conclusion may later prove incorrect. Likewise, the null hypothesis is rejected even when future evidence may produce different results.
Because of this uncertainty, understanding hypothesis testing and statistical principles becomes essential for reliable decision-making.
Significance Level, Probability, and Statistical Errors in Hypothesis Testing
A Statistical Hypothesis depends heavily on probability and error control. These concepts help researchers determine whether results occurred by chance.
What Is the Significance Level?
- The significance level represents the maximum probability of rejecting the null when the true null hypothesis actually exists.
- It is also known as alpha (α).
- Researchers commonly use a significance level of 0.05.
Common values include:
- 0.10
- 0.05
- 0.01
Why Is a Significance Level of 0.05 Popular?
- A significance level of 0.05 means researchers accept a 5% probability of rejecting the null incorrectly.
- It balances sensitivity and reliability.
- Many statistical methods and statistical test procedures adopt this standard.
Understanding Statistical Significance
Results become statistically significant when:
- The p-value is smaller than the level of significance.
- Researchers would reject the null hypothesis.
- Strong statistical evidence supports the findings.
However, the American Statistical Association emphasizes that statistical significance alone should not determine scientific conclusions.
Type I Error
One of the two types of errors is the type i error.
A type i error occurs if the null hypothesis is rejected even though the null hypothesis is valid.
This means:
- The hypothesis is rejected even though no true effect exists.
- A false positive result occurs.
- Type i and type ii errors are unavoidable in research.
Example:
A medical test indicates disease when no disease exists.
Type II Error
A type ii error occurs when:
- The null hypothesis is false.
- Researchers fail to reject the null.
- A true effect is missed.
This error creates false negatives.
Summary of the Two Types of Errors
Type I Error
- Null hypothesis is rejected even though the true null hypothesis exists.
- False positive outcome.
Type II Error
- Null hypothesis is false.
- Null hypothesis is not rejected.
- False negative outcome.
Statistical Power
- Statistical power measures the probability of correctly rejecting the null hypothesis.
- High statistical power reduces errors in hypothesis testing.
- Larger sample size generally increases power.
- Better statistical practices improve power.
Probability of Rejecting the Null
The probability of rejecting the null depends on:
- Sample size.
- Variability in the data.
- Selected significance level.
- Effect size.
- Statistical test procedures.
Multiple Testing and Statistical Errors
Multiple testing increases the likelihood of statistical errors.
Researchers should:
- Apply proper statistical methods.
- Use adjustment procedures when necessary.
- Avoid making misleading conclusions.
Hypothesis testing is also more reliable when statistical analysis is carefully planned before data collection.
Examples of Hypothesis and Real-World Applications of Testing Statistical Hypotheses
A Statistical Hypothesis is valuable because it solves real-world problems.
Below are several examples of hypothesis used in everyday research.
Example 1: Education Research
Question:
Does online learning improve student performance?
- H₀: Online learning has no effect.
- H₁: Online learning improves performance.
Researchers perform a statistical hypothesis test to determine which hypothesis receives support.
Example 2: Medical Research
Question:
Does a new medication lower blood pressure?
- H₀: The medication has no effect.
- H₁: The medication lowers blood pressure.
This application of hypothesis testing helps physicians evaluate treatments.
Example 3: Marketing Studies
Question:
Does a new advertisement increase sales?
- H₀: Sales remain unchanged.
- H₁: Sales increase.
Statistical hypothesis testing plays an important role in business decisions.
Example 4: Comparing a Difference Between Two Groups
Question:
Do men and women spend different amounts online?
- H₀: Mean spending is equal.
- H₁: Mean spending differs.
Researchers use inferential statistics to test for the hypothesis.
Example 5: Manufacturing Quality Control
Question:
Is the defect rate above 2%?
- H₀: Defect rate = 2%.
- H₁: Defect rate > 2%.
This Statistical Hypothesis helps organizations maintain product quality.
Example 6: Psychology Research
Question:
Does stress affect sleep duration?
- H₀: No relationship exists.
- H₁: A relationship exists.
Testing statistical hypotheses allows psychologists to understand human behavior.
Importance of Real-World Applications
The application of hypothesis testing supports:
- Healthcare decisions.
- Business planning.
- Government policies.
- Scientific discoveries.
- Educational improvement.
Without Statistical Hypothesis methods, reliable statistical inference would be difficult.
How To Write Statistical Hypothesis With Examples: Best Practices for Creating the Correct Hypothesis in Inferential Statistics
Writing a correct hypothesis improves the quality of statistical analysis and research conclusions.
1. Begin With a Clear Research Question
Before making a hypothesis:
- Identify the problem.
- Define measurable variables.
- Specify the target population.
A well-defined question produces stronger statistical hypotheses.
2. Write a Precise Hypothesis Statement
Your hypothesis statement should:
- Be clear.
- Be testable.
- Avoid vague language.
- Focus on measurable outcomes.
3. Ensure the Null and Alternative Hypotheses Match
The null hypothesis and alternative hypothesis should:
- Address the same parameter.
- Be mutually exclusive.
- Cover all possible outcomes.
4. Select the Appropriate Statistical Test
Different statistical tests answer different questions.
Choose statistical methods based on:
- Sample size.
- Variable type.
- Research design.
- Data characteristics.
5. Avoid Common Mistakes
Common errors include:
- Making a hypothesis that cannot be measured.
- Confusing statistical terms.
- Using the wrong statistical test.
- Ignoring sample size requirements.
- Performing hypothesis testing after examining the data.
6. Follow Principles of Hypothesis Testing
Good statistical practices include:
- Assuming the null hypothesis initially.
- Using proper statistical analysis.
- Reporting results honestly.
- Interpreting findings carefully.
7. Focus on Statistical Evidence
A Statistical Hypothesis should always be supported by:
- Data.
- Test statistic results.
- Probability calculations.
- Statistical significance.
8. Understand Frequentist Hypothesis Approaches
Modern hypothesis testing relies heavily on the frequentist hypothesis framework.
This approach emphasizes:
- Probability-based decisions.
- Statistical inference.
- Error control.
- Objective conclusions.
9. Remember That Evidence Is Never Absolute
Even when the alternative hypothesis is true, uncertainty still exists.
Researchers should remember:
- A hypothesis may change with new evidence.
- Statistical significance does not guarantee practical importance.
- No single study proves a theory permanently.
Final Best-Practice Checklist
Before performing hypothesis testing, verify that:
✓ The research question is clear.
✓ The Statistical Hypothesis is measurable.
✓ Null and alternative hypotheses are correctly written.
✓ Appropriate statistical methods are selected.
✓ Sample size is adequate.
✓ The significance level is specified.
✓ Results are interpreted responsibly.
Following these guidelines helps researchers create the correct hypothesis and produce reliable conclusions in inferential statistics.
Research Hypotheses
Types of Research Hypotheses
Explore key hypothesis categories used in academic research and studies.
Types of Hypotheses
Overview
→
Research Hypotheses
Basics
→
Alternative
H1
→
Null
H0
→
Directional
One-tailed
→
Non-Directional
Two-tailed
→
Simple
One variable
→
Complex
Multiple variables
→
Causal
Cause-effect
→
Associative
Relationship
→
Statistical
Testing
→
Working
Temporary
→
Declarative
Statement form
→
Question Form
Question-based
→
Empirical
Observed data
→
Logical
Reasoned
→
Value
Business focus
→