
Blog
How To Write Null Hypothesis With Examples
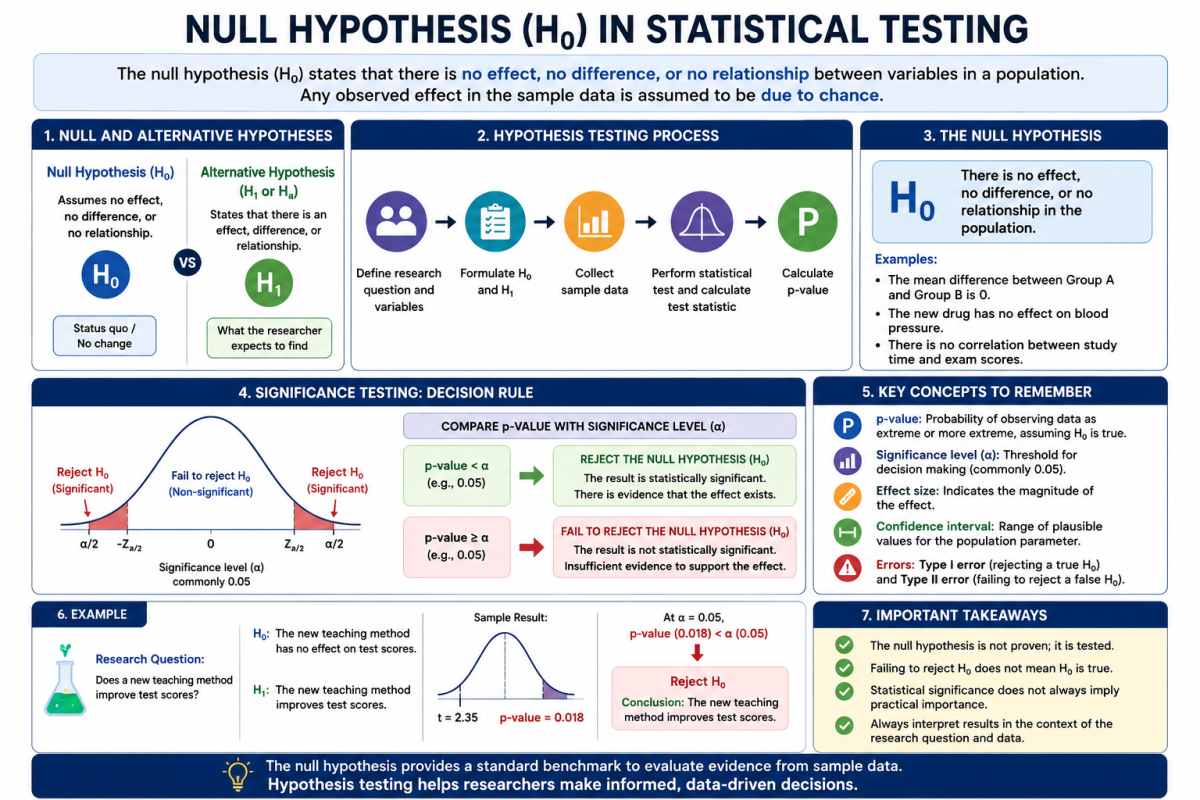
Introduction: How To Write Null Hypothesis and Understand Its Role in Statistical Analysis
- Definition of a Hypothesis
- A hypothesis is a foundational concept in statistical analysis. It is a statement about a population parameter that can be tested using observed data.
- Hypotheses are formulated to answer a specific research question. They help determine relationships between variables, such as whether an independent variable affects a dependent variable.
- Null Hypothesis: Core Concept
- The null hypothesis (H₀) is a statement that there is no effect, no difference, or no relationship between variables.
- It assumes that any observed effect in the data is due to chance rather than a true relationship.
- Understanding null hypothesis is crucial because it forms the basis for significance testing and statistical hypothesis testing.
- Alternative Hypothesis: The Complement
- The alternative hypothesis (H₁ or Ha) specifies what the researcher expects to find. It states that the null hypothesis is not true, meaning there is a statistically significant effect or relationship.
- Null and alternative hypotheses are always considered together in hypothesis testing. You can either reject the null or fail to reject it, based on evidence from observed data.
- Role in Statistical Analysis
- The null hypothesis is a foundational concept in statistical methods for research workers, as introduced by Ronald Fisher.
- Null hypothesis testing allows researchers to quantify the probability of observing their data if the null hypothesis were true.
- Statistical tests, such as t-tests, chi-square tests, and ANOVA, rely on comparing observed data to what would be expected under the null hypothesis.
- The p-value, effect size, and confidence interval are key metrics in assessing whether the null hypothesis can be rejected.
- Significance of Understanding Null Hypothesis
- Proper understanding of null hypothesis significance testing (NHST) helps prevent misinterpretation of statistical results.
- It ensures that researchers do not claim evidence for a relationship or effect without proper statistical support.
- The null hypothesis is used not to prove anything, but to provide a standard benchmark against which the observed data can be evaluated.
Step-by-Step Guide: How To Write Null Hypothesis in 7 Simple Steps
- Identify the Research Question
- Clearly define what you are investigating. The research question guides the formulation of both null and alternative hypotheses.
- Example: “Does study time influence exam scores among college students?”
- Determine Variables
- Identify the independent variable (e.g., study time) and dependent variable (e.g., exam score).
- This step is crucial because the null hypothesis will assume no effect of the independent variable on the dependent variable.
- Specify the Null Hypothesis
- Write a null hypothesis that reflects no effect, no difference, or no relationship.
- Example: “The amount of study time has no effect on exam scores.”
- This null hypothesis assumes that any variation in exam scores is due to random chance, not study time.
- Formulate the Alternative Hypothesis
- Specify the expected effect or difference in measurable terms.
- Example: “Increased study time leads to higher exam scores.”
- This specific alternative hypothesis guides the direction of your statistical test.
- Choose the Statistical Method
- Decide on the appropriate statistical test based on the type of variables and research design (e.g., t-test, ANOVA, regression).
- Null hypothesis testing is applied using these statistical methods to determine whether the observed data is inconsistent with the null hypothesis.
- Set the Significance Level (α)
- The significance level (commonly 0.05) determines the threshold for rejecting the null hypothesis.
- If the p-value from the statistical test is less than α, the null hypothesis can be rejected; otherwise, we fail to reject the null.
- Write a Clear, Testable Hypothesis Statement
- Ensure the null hypothesis is precise, measurable, and clearly states the population parameter involved.
- Example for a population mean: “The mean exam score of students who study for 2 hours is equal to the mean exam score of students who study for 0 hours.”
- This format allows direct application of statistical methods to test the hypothesis.
Defining the Null Hypothesis vs. Alternative Hypotheses in Statistical Testing
- Null Hypothesis (H₀)
- Assumes no effect or no relationship between variables.
- Provides a baseline for statistical testing.
- Helps quantify the probability of observing the data assuming the null hypothesis is true.
- Alternative Hypothesis (H₁ / Ha)
- Specifies a difference, effect, or relationship that contradicts the null.
- The alternative hypothesis is true if the null hypothesis is rejected with sufficient statistical evidence.
- This is tested using statistical methods, p-values, and confidence intervals.
- Decision Outcomes
- Fail to reject the null: Observed data is consistent with H₀; results are non-significant.
- Reject the null: Observed data is inconsistent with H₀; results are statistically significant.
- Type I and Type II Errors
- Type I error occurs if the null hypothesis is rejected when it is actually true.
- Type II error occurs if the null hypothesis is not rejected when the alternative hypothesis is true.
- Understanding these error rates is critical in interpreting hypothesis tests and significance testing.
- Two Hypotheses Together
- Null and alternative hypotheses form the two sides of a statistical test.
- A statistical hypothesis testing framework evaluates which hypothesis is more consistent with observed data.
Understanding Null Hypothesis Significance Testing (NHST) and Its Applications
- Overview of NHST
- Null hypothesis significance testing combines null hypothesis, test statistic, and p-value to make decisions about research questions.
- It does not prove the null hypothesis is true or false; it measures whether the observed effect is likely due to chance.
- Step 1: Assume the Null Hypothesis
- NHST starts with the assumption that the null hypothesis is true.
- Observed data is then compared against expected outcomes under H₀.
- Step 2: Select a Test Statistic
- The test statistic (e.g., t-value, F-value) measures how far observed data deviates from the null expectation.
- Larger deviations indicate more evidence against the null hypothesis.
- Step 3: Calculate the p-value
- The p-value represents the probability of observing data as extreme or more extreme than what was collected, assuming the null hypothesis is true.
- If p-value < 0.05, the null hypothesis can be rejected; the results are statistically significant.
- If p-value ≥ 0.05, fail to reject the null; the result is non-significant.
- Step 4: Interpret the Results
- Rejecting the null provides evidence that the alternative hypothesis is more consistent with observed data.
- Failing to reject the null does not prove H₀ is true; it simply indicates insufficient evidence to support the alternative.
- NHST also considers effect size and confidence intervals for practical interpretation.
- Applications of NHST
- NHST is widely used in social sciences, biology, medicine, and business research.
- It informs decisions based on observed effects, population parameters, and sample sizes.
- Enables researchers to refute the null or conclude that the null hypothesis cannot be rejected with confidence.
- Advantages of NHST
- Provides a structured approach for hypothesis testing.
- Helps maintain consistency across studies using standard significance thresholds.
- Allows researchers to quantify uncertainty in decision-making.
- Limitations
- p-value alone proves nothing; results must be interpreted alongside effect size and confidence intervals.
- NHST does not confirm the alternative hypothesis is true, only whether data is inconsistent with the null.
- Researchers should avoid over-reliance on a 0.05 threshold, considering practical and theoretical context.
- Key Considerations
- Sample size affects statistical power: larger samples make it easier to detect small effects.
- Ensure correct choice of the null hypothesis before conducting the statistical test.
- Be mindful of Type I and Type II errors, as these can affect conclusions drawn from NHST.
How Hypothesis Testing Works: Key Concepts in Null and Alternative Hypotheses
- Overview of Hypothesis Testing
- Hypothesis testing is a statistical method used to evaluate claims about population parameters.
- It involves two hypotheses: null hypothesis (H₀) and alternative hypothesis (H₁ or Ha).
- The null hypothesis is a foundational assumption, often stating there is no relationship between variables or no effect of an independent variable on a dependent variable.
- The alternative hypothesis specifies the expected effect, guiding the direction of statistical tests.
- How To Write Null Hypothesis begins with clearly identifying the null, which is critical to meaningful hypothesis testing.
- Step 1: Formulate Two Hypotheses
- Null hypothesis: assumes any observed effect is due to chance.
- Alternative hypothesis: states a specific relationship between variables or predicts a measurable difference.
- These two hypotheses provide a framework for the statistical test.
- Example: In testing a new drug, the null hypothesis could state that the drug has no effect on blood pressure, while the alternative hypothesis claims it lowers blood pressure.
- Step 2: Determine the Statistical Test
- The choice of test depends on data type, sample size, and research question.
- Common statistical tests include t-tests, ANOVA, chi-square tests, and regression analysis.
- Each test calculates a test statistic, which is then compared to critical values or used to compute a p-value.
- Step 3: Assume the Null Hypothesis
- Hypothesis testing works by assuming the null hypothesis is true.
- The observed data is analyzed to see if it is consistent with this assumption.
- If the observed effect is highly unlikely due to chance, it provides evidence against the null hypothesis.
- Step 4: Compute the Test Statistic and p-value
- The test statistic quantifies the difference between observed data and the null hypothesis expectation.
- The p-value represents the probability of observing the effect (or more extreme) if the null hypothesis is true.
- Standard threshold (α = 0.05) is used to determine statistical significance:
- If p-value < 0.05, the null hypothesis can be rejected.
- If p-value ≥ 0.05, fail to reject the null; results are non-significant.
- Step 5: Make a Decision
- Reject the null hypothesis if the data is statistically inconsistent with H₀.
- Fail to reject the null if observed data could plausibly occur due to chance.
- Decision-making also considers effect size and confidence intervals for practical significance.
- Step 6: Consider Type I and Type II Errors
- Type I error: rejecting a true null hypothesis.
- Type II error: failing to reject a false null hypothesis.
- Understanding error rates is essential for designing tests and interpreting results.
- Sample size impacts these error rates: larger samples reduce Type II error and improve detection of statistically significant effects.
- Step 7: Interpretation in Context
- A rejection of the null hypothesis does not prove the alternative is true; it indicates inconsistency with the null.
- A non-significant result or failure to reject the null does not confirm H₀; it simply indicates insufficient evidence to support the alternative hypothesis.
- How To Write Null Hypothesis properly ensures clarity and reproducibility in interpretation.
Choosing the Right Null Hypothesis: Statistical Methods and Significance Testing
- Understanding the Choice of the Null Hypothesis
- Defining the null hypothesis correctly is critical. A poorly formulated H₀ can lead to misleading conclusions.
- Null hypotheses should be specific, measurable, and testable.
- Sometimes the null hypothesis could reflect equality, no correlation, or no effect, depending on the research design.
- Statistical Methods for Defining Null Hypotheses
- Use appropriate statistical methods for research workers (as suggested by Ronald Fisher).
- The null hypothesis must specify the population distribution and parameters, such as population mean or proportion.
- Common methods: t-test for means, chi-square test for proportions, ANOVA for multiple groups, and regression for relationships between dependent and independent variables.
- Significance Testing
- The null hypothesis provides a benchmark for significance testing.
- Statistical tests evaluate whether observed data deviates enough from H₀ to conclude a statistically significant effect.
- Confidence intervals offer additional context: if a CI includes the null value, the null hypothesis is not rejected.
- Factors Affecting Choice
- Sample size: small samples reduce the power to detect effects, increasing Type II errors.
- Effect size: a small but meaningful effect may require larger samples to achieve statistical significance.
- Research question: the null should align precisely with the aim of the study.
- Practical Tips
- Write a null hypothesis that is clear and unambiguous.
- Avoid overly broad nulls; they may fail to detect meaningful effects.
- Remember that the null hypothesis is a foundational concept that anchors hypothesis testing and ensures valid statistical analysis.
Examples of Null Hypotheses Across Different Research Questions
- Example 1: Education
- Research question: Does extra tutoring improve math scores?
- Null hypothesis: “Extra tutoring has no effect on math scores.”
- Alternative hypothesis: “Extra tutoring improves math scores.”
- Statistical test: t-test comparing mean scores of tutored vs. non-tutored groups.
- Example 2: Medicine
- Research question: Does a new drug lower blood pressure?
- Null hypothesis: “The new drug has no effect on blood pressure.”
- Alternative hypothesis: “The new drug reduces blood pressure.”
- Observed effect can be evaluated with p-value and confidence interval for clinical significance.
- Example 3: Social Science
- Research question: Is there a relationship between social media use and anxiety?
- Null hypothesis: “Social media use is unrelated to anxiety levels.”
- Alternative hypothesis: “Higher social media use is associated with higher anxiety.”
- Statistical test: correlation or regression analysis with proper null hypothesis testing.
- Example 4: Business
- Research question: Does a new marketing campaign increase sales?
- Null hypothesis: “The marketing campaign has no effect on sales.”
- Alternative hypothesis: “The marketing campaign increases sales.”
- Test: ANOVA or t-test depending on the number of groups and data distribution.
- Key Takeaways
- Examples of null hypotheses show how they are applied across domains.
- They provide a framework to quantify evidence against the null, interpret p-values, and decide whether results are statistically significant.
- Correct formulation ensures that null hypothesis significance testing works reliably.
Strengthening Your Statistical Knowledge: Advanced Insights on Null Hypothesis Testing
- Understanding Nuances
- The null hypothesis is a foundational concept; however, statistical analysis must go beyond simple rejection.
- Consider observed effect is due to chance, effect size, and confidence intervals to evaluate practical significance.
- Interpreting Non-Significant Results
- Failure to reject the null does not mean the null hypothesis is true.
- Non-significant results can arise due to small sample size, low effect size, or measurement variability.
- Type II errors are common in underpowered studies.
- Refuting the Null vs. Proving the Alternative
- Statistical tests refute the null rather than prove the alternative hypothesis is true.
- Always interpret p-value alongside effect size to assess real-world importance.
- Multiple Comparisons and Error Rates
- Conducting multiple tests inflates Type I error rate.
- Adjust significance thresholds using Bonferroni correction or similar methods.
- Understanding error rates is key to robust statistical hypothesis testing.
- Role of Sample Size
- Larger random samples improve reliability of tests.
- Sample size affects probability of rejecting a false null hypothesis (power) and ensures statistically significant results reflect true effects rather than random variation.
- Integrating Advanced Metrics
- Use effect size to quantify the magnitude of observed differences.
- Confidence intervals provide a range of plausible values for population parameters under the null hypothesis.
- This enhances understanding null hypothesis beyond simple significance testing.
- Continuous Learning
- Null hypothesis significance testing is widely used but can be misunderstood.
- Deepening knowledge of statistical methods, test statistics, and p-values allows researchers to make more informed, evidence-based decisions.
- Mastering How To Write Null Hypothesis and its applications ensures clarity, reproducibility, and credibility in research findings.
Research Hypotheses
Types of Research Hypotheses
Explore key hypothesis categories used in academic research and studies.
Types of Hypotheses
Overview
→
Research Hypotheses
Basics
→
Alternative
H1
→
Null
H0
→
Directional
One-tailed
→
Non-Directional
Two-tailed
→
Simple
One variable
→
Complex
Multiple variables
→
Causal
Cause-effect
→
Associative
Relationship
→
Statistical
Testing
→
Working
Temporary
→
Declarative
Statement form
→
Question Form
Question-based
→
Empirical
Observed data
→
Logical
Reasoned
→
Value
Business focus
→